Oil and gas production in Laramie County, Wyoming has increased over the last 10 years with the increased development in the Niobrara shale formation and then again, more recently, with the discovery and development of the Codell sandstone formation. Drillnomics has analyzed 15 horizontal producing wells in the southeast portion of Laramie County using public production data and information from publically traded companies’ investor presentations. The evaluation and analysis includes 8 horizontal Niobrara shale wells and 7 horizontal Codell sandstone wells. The analysis focus area is 13N63W, 14N63W, 14N64W, and 14N65W. Figures 1-4 show the oil and gas type curves developed for the Niobrara shale and Codell sandstone formations for these areas.
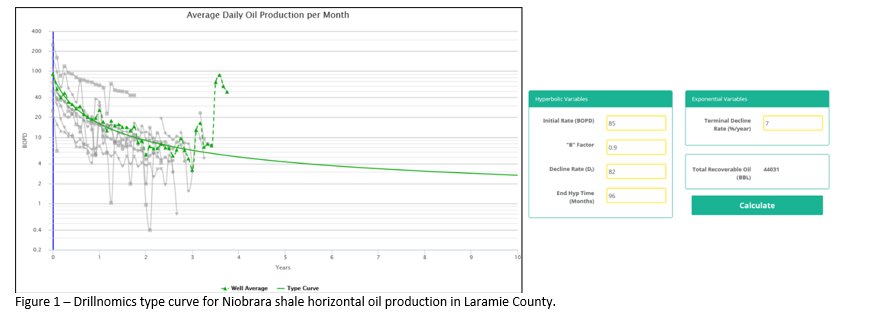
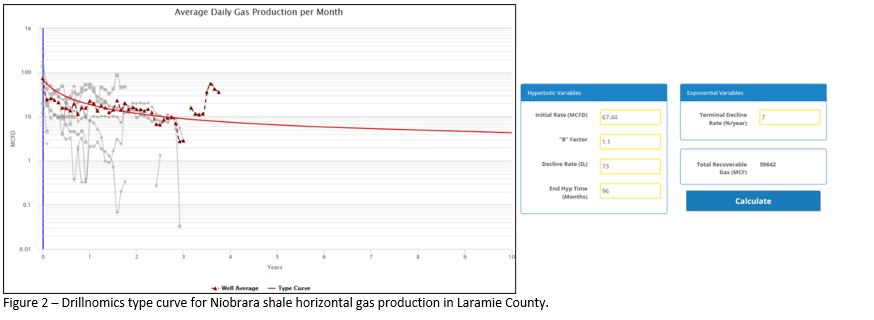
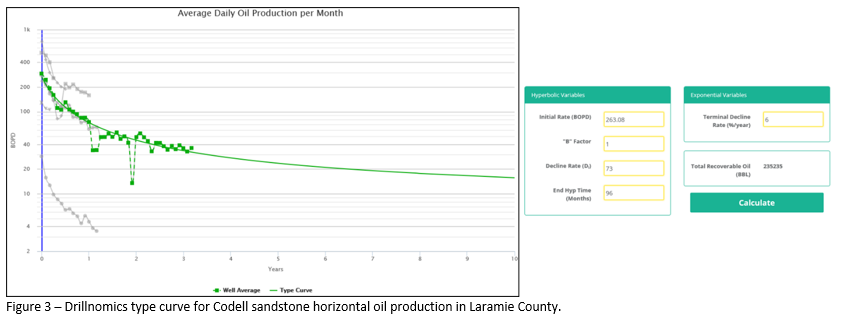
Drillnomics also analyzed this same group of wells on a township/range level. Tables 1 and 2 show the EUR of the type curves for the Niobrara and Codell in each township/range.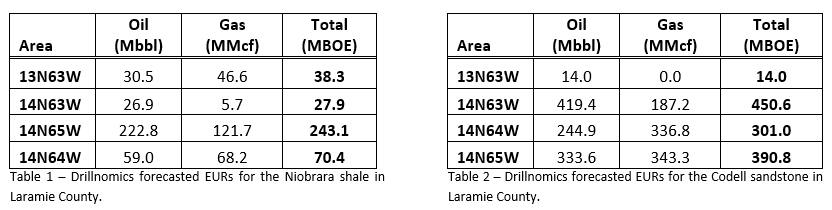
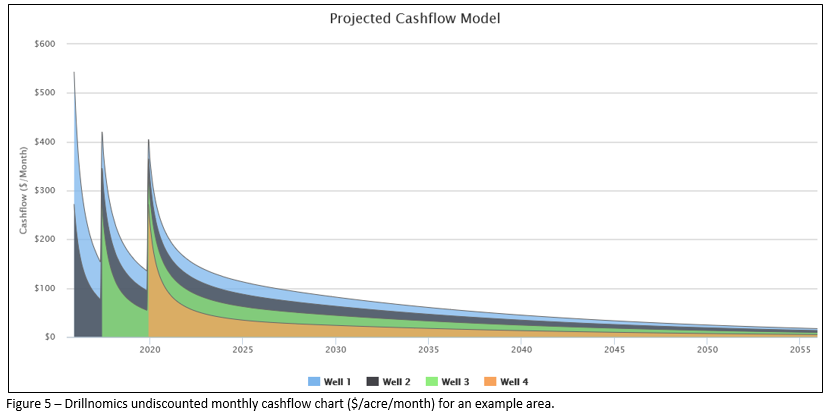
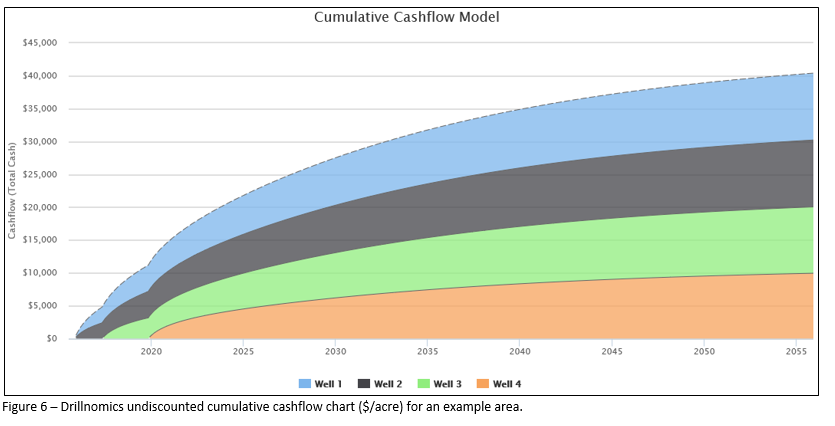
Drillnomics calculated a cashflow model per acre for the Niobrara/Codell type curve in the region. The economic input parameters are based on public data from EOG Resources, Bill Barrett Corporation, and Sundance Energy investor presentations. An example of the undiscounted cashflow and cumulative cashflow charts generated by Drillnomics are shown in Figures 5 and 6. In this example, it is assumed that this particular area will have 2 wells producing at the starting date of the analysis, an additional well brought on 1.5 years into the analysis, and the final well brought on 4 years into the analysis. The cashflow base assumptions assume an 18.75% royalty and 1 net mineral acre on a 160 acre spacing unit so that the mineral value can be reported on a dollar per acre metric. Figure 7 shows the Drillnomics value summary for this example, using the type curves and future development assumptions discussed above.
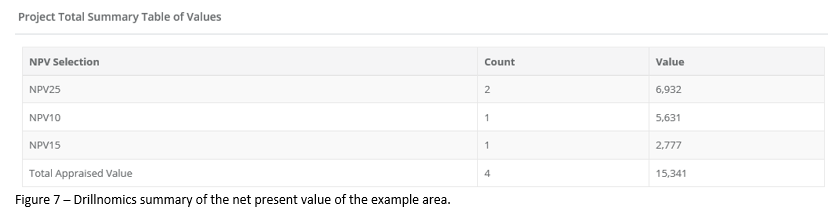
There are several items that can impact the overall value of the minerals in these areas, such as realized gas prices, NGL yield, and terms of the lease, so there is room for variance on the economic analysis. In this example, Drillnomics calculated the value of the minerals to the owner, assuming a 0% working interest and a royalty set by the terms of the lease. Drillnomics is also capable of using the same type curves with different economic inputs to determine the economic value of existing wells and future development projects to an operator or other entity with a working interest in the area.
________________________________________
Drillnomics is a web based oil and gas decline curve and economic analysis tool. The decline curves and economic evaluations were conducted by engineers from the Drillnomics team with the intention of showcasing the power of this new and revolutionary web based tool.
For more information or a free trial for Drillnomics, visit us at www.drillnomics.com and experience one of the fastest growing oil and gas tools on the market with a growth rate of over 700% in less than 1 year and a tester-to-subscriber conversion rate of nearly 80%. Follow us on Facebook and LinkedIn to continue receiving Drillnomics analysis of additional major US oil and gas plays.
This analysis is not intended for use as an investing guideline. Companies and individuals should conduct their own independent analysis before making any financial or investment decisions.
No Comments
Be the first to start a conversation