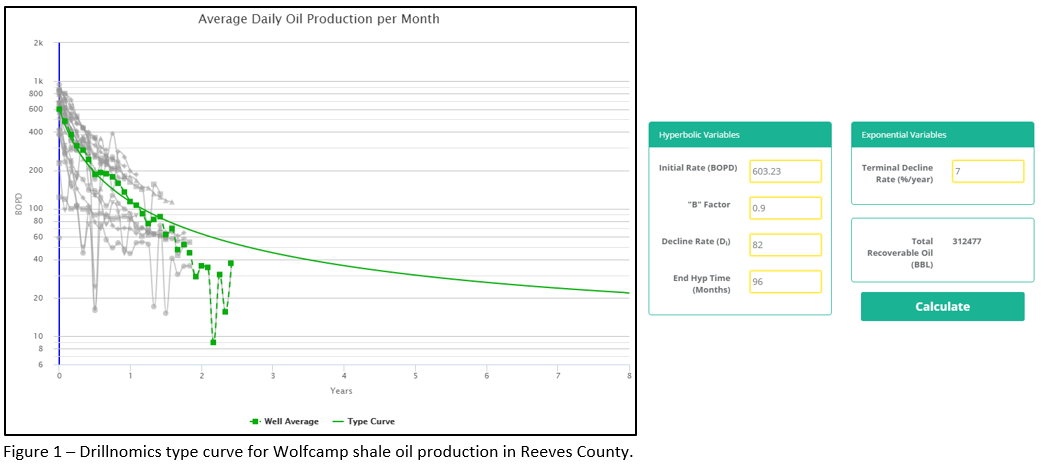
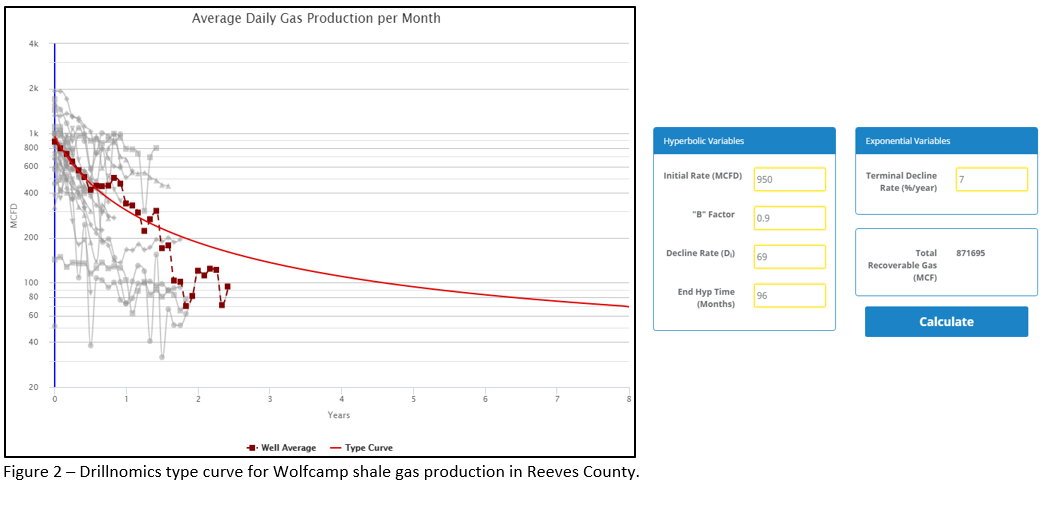
In the last 5 years, the mature Permian Basin has been brought back into the oil and gas spotlight as one of the most prolific unconventional resource plays in the United States with the discovery and development of shale formations. Development in the Permian Basin, and specifically the Delaware Basin, which is located on the western side of the greater Permian Basin, has historically been achieved through vertical drilling and production. In the last 5 years, much of the development has shifted to horizontal completions in the shale zones. The two main shale formations in the Delaware Basin are the Wolfcamp and the Bone Spring. Drillnomics has analyzed 27 producing horizontal wells in the Wolfcamp formation using public production data and information from publically traded companies’ investor presentations. While the Delaware Basin covers much of Eddy and Lea counties in New Mexico and the west Texas counties of Culberson, Loving, Reeves and Ward, this analysis focus on horizontal Wolfcamp wells in block 50 T8S and block 51 T8S, which are in the south east portion of Reeves county, Texas. Figures 1 and 2 show the oil and gas type curves developed for the Wolfcamp formation in this area.
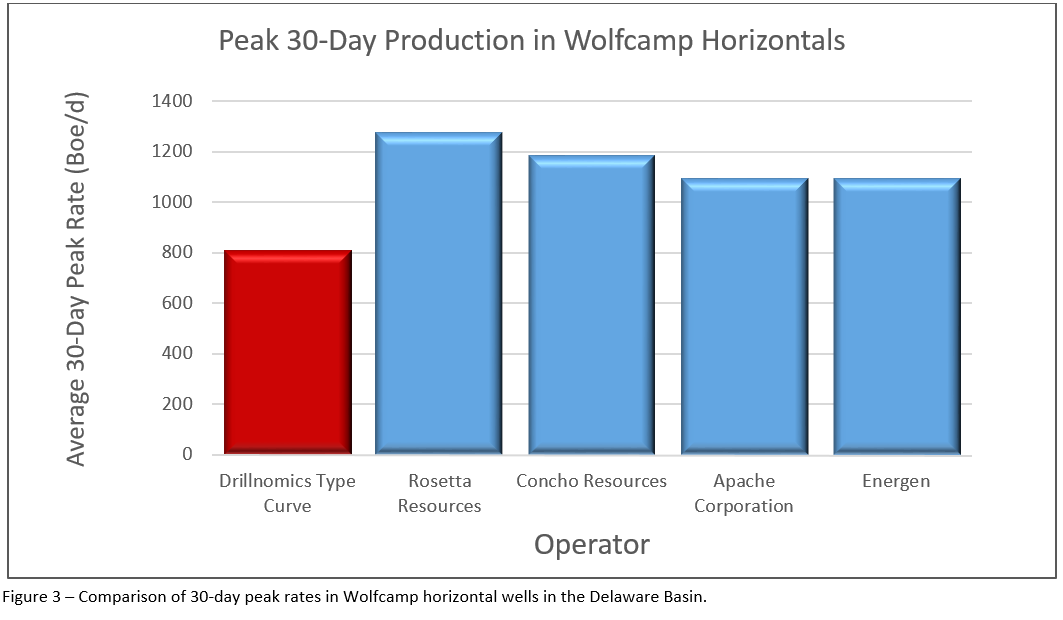
Drillnomics compared the average peak 30-day rates (Boe/d) of the 27 type curve wells to the peak 30-day rates reported by operators. Figure 3 shows this comparison. It should be noted that the focus area of this analysis is on the south end of the Wolfcamp play and results reported by operators are derived from wells across the entire Wolfcamp play in the Delaware Basin.
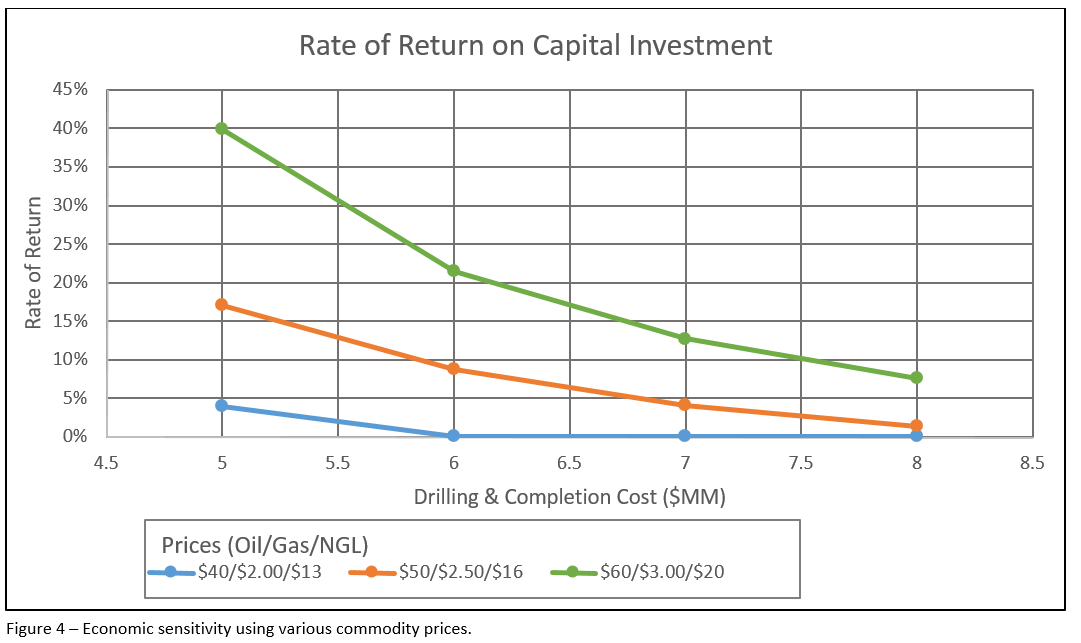
The economic feasibility of the Drillnomics type curve was analyzed using economic input parameters from publically traded companies’ investor presentations. The capital development cost is based on data from Occidental Petroleum Corporation, Apache Corporation, and Energen. The lease operating expense is based on data from Rosetta Resources, Concho Resources, and Energen. The economic sensitivity for each type curve was analyzed utilizing a range of oil, gas and NGL prices, as shown in Figure 4.
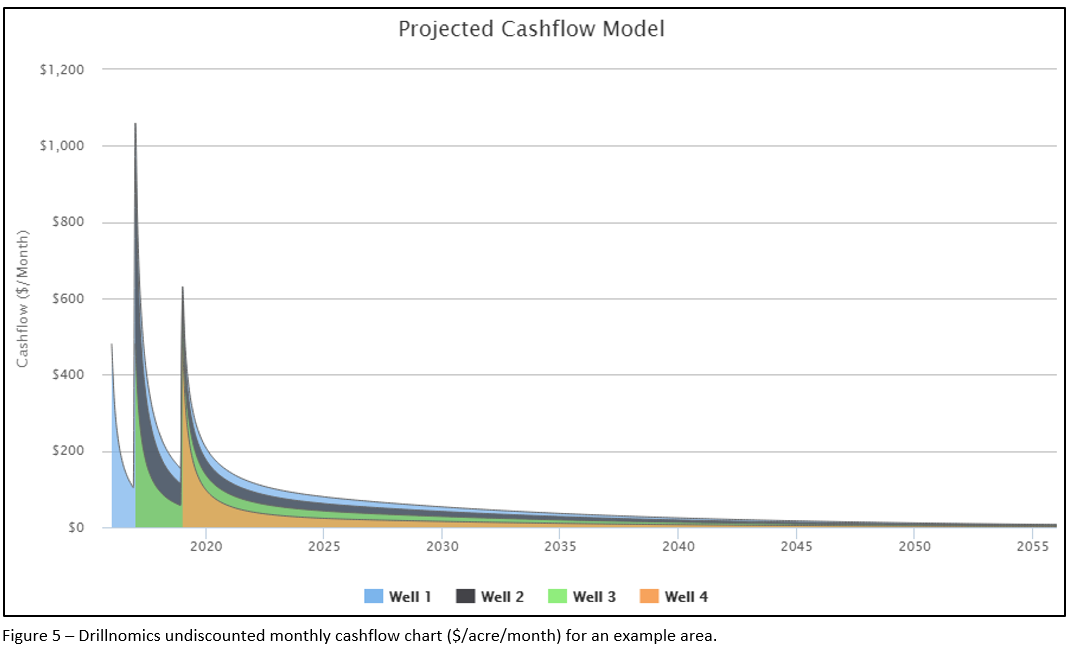
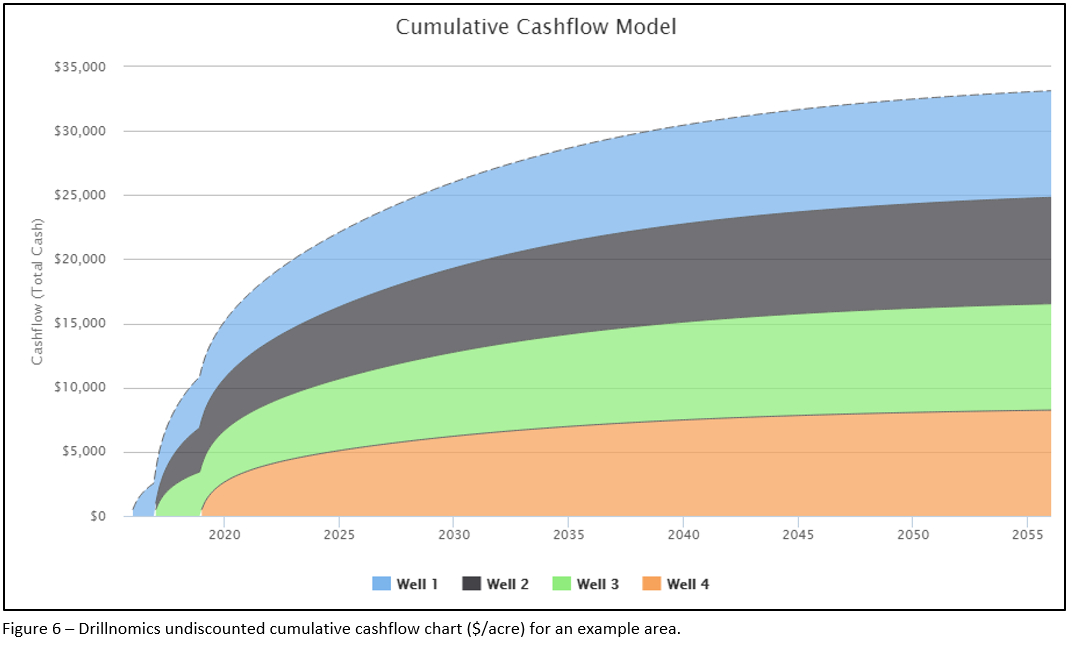
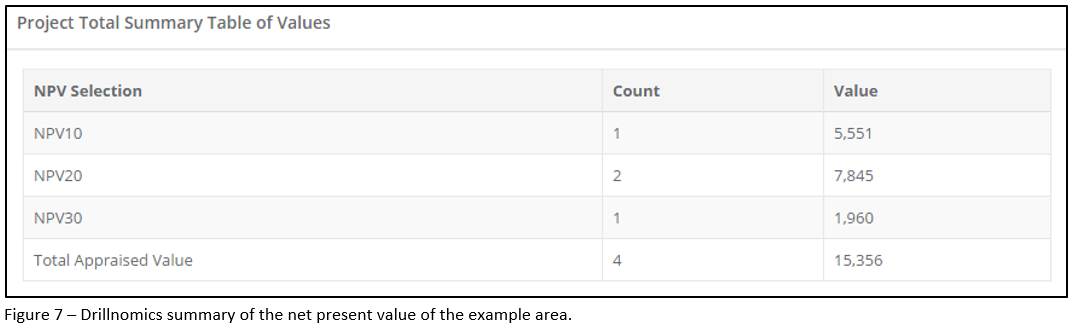
Drillnomics also calculated a hypothetical cashflow model per acre of the acreage in the southern portion of the Wolfcamp play using the type curve for the region. The economic input parameters are based on public data from Apache Corporation, Occidental Petroleum Corporation, Rosetta Resources, Concho Resources and Energen investor presentations. An example of the undiscounted cashflow and cumulative cashflow charts generated by Drillnomics are shown in Figures 5 and 6. In this example, it is assumed that this particular area will have 1 well producing at the starting date of the analysis, an additional 2 wells brought on at the beginning of year 2 of the analysis, and the final well brought on 4 years into the analysis. The cashflow base assumptions assume a 15% royalty and 1 net mineral acre on a 160 acre spacing unit so that the mineral value can be reported on a dollar per acre metric. Figure 7 shows the Drillnomics value summary for this example, using the type curves and future development assumptions discussed above.
There are several items that can impact the overall value of the minerals in these areas, such as realized gas prices, NGL yield, and terms of the lease, so there is room for variance on the economic analysis. This article is intended to serve as a demonstration of Drillnomics’ ability to value property from the perspective of an operator, non-operating partner, or mineral owner.
Drillnomics is a web based oil and gas decline curve and economic analysis tool. The decline curves and economic evaluations were conducted by engineers from the Drillnomics team with the intention of showcasing the power of this new and revolutionary web based tool.
For more information or a free trial for Drillnomics, visit us at www.drillnomics.com and experience one of the fastest growing oil and gas tools on the market with a growth rate of over 700% in less than 1 year and a tester-to-subscriber conversion rate of nearly 80%. Follow us on Facebook and LinkedIn to continue receiving Drillnomics analysis of additional major US oil and gas plays.
This analysis is not intended for use as an investing guideline. Companies and individuals should conduct their own independent analysis before making any financial or investment decisions.
No Comments
Be the first to start a conversation