The Utica/Point Pleasant shale play has triggered a large stir in the oil and gas world. The shale play that initially kicked off with the Chesapeake Energy hype in Carrol and Jefferson Counties has now expanded south into new areas such as Washington, Noble, and Monroe Counties. The Utica expansion into these areas has been analyzed by Drillnomics using public production data and information from publically traded investor presentations.
The Utica shale play in northern Washington county and southern Noble and Monroe Counties is early in development which leaves a lot of room for opportunity. Drillnomics evaluated 16 horizontal Utica shale wells that had greater than 6 months of production history. The analysis focus area is Graysville Township in Washington County and the surrounding townships. Figure 1 shows the 6 month cumulative gas production as it relates to the measured depth of the well. The depth of the Utica is reasonably consistent in the area; therefore, the measured depth is a reasonable indicator of the lateral lengths for each well.
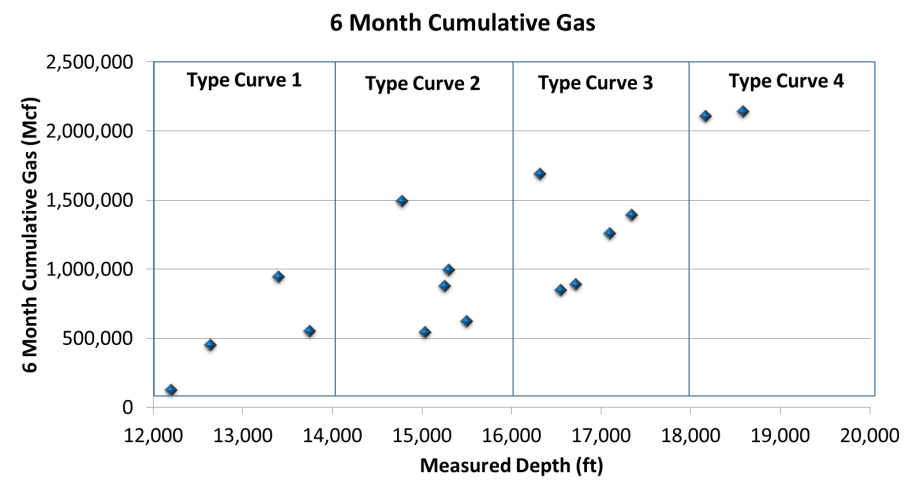
Figure 1 – Six month cumulative gas production from horizontal Utica wells in Washington County area as a function of total measured depth.
Based on the measured depth variance, Drilllnomics separated the wells into four different type curves to analyze the EUR and estimated economic viability of the wells, as shown in Figure 1. The type curves of each measured depth grouping are listed below in Figures 2, 3, 4, and 5 with the forecast parameters listed next to each graph.
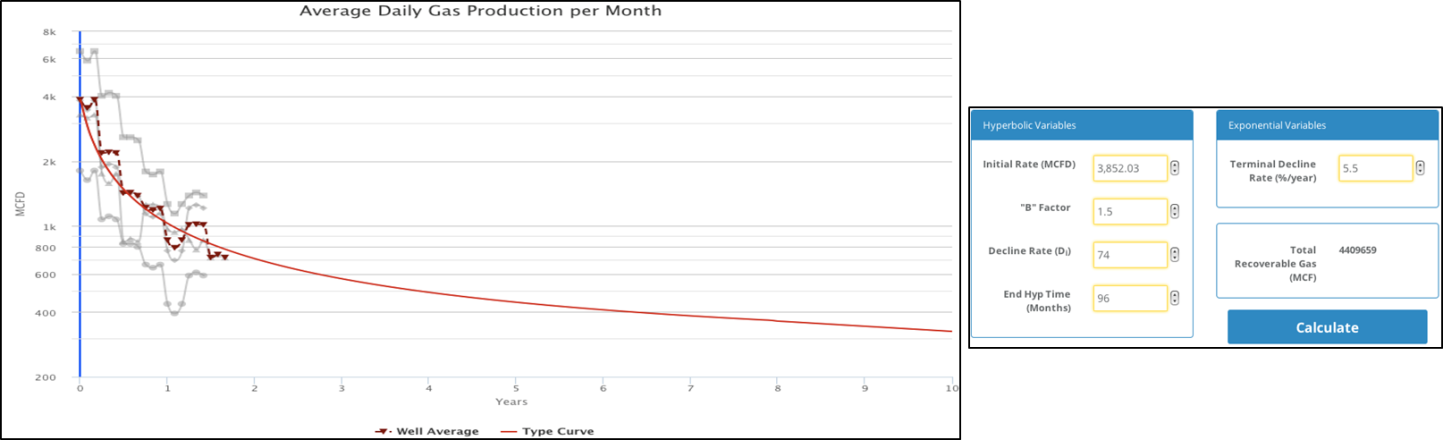 Figure 2 – Drillnomics type curve 1 for Utica shale horizontal production in Washington County.
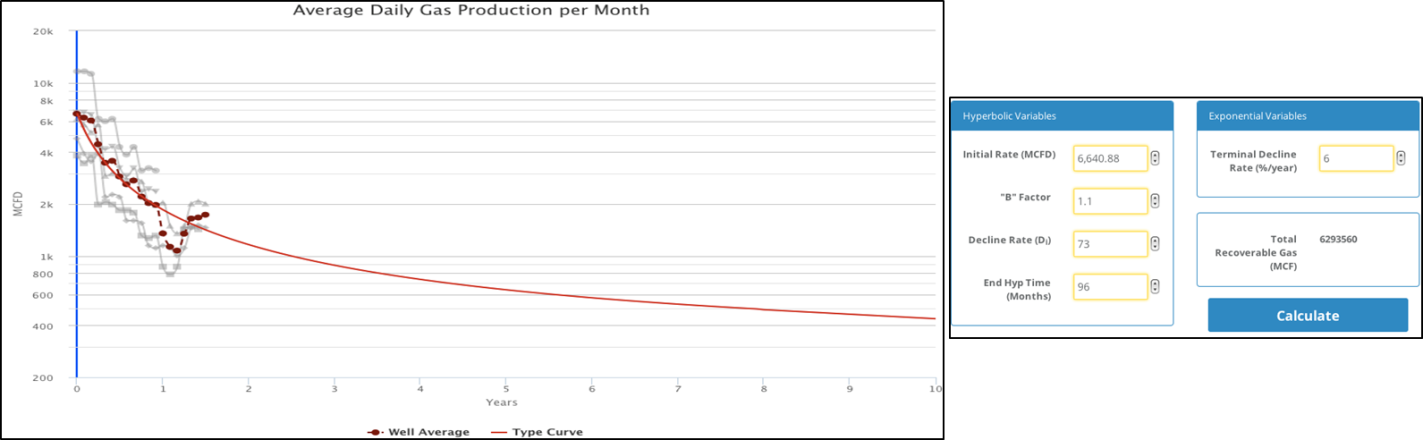
Figure 3 – Drillnomics type curve 2 for Utica shale horizontal production in Washington County.
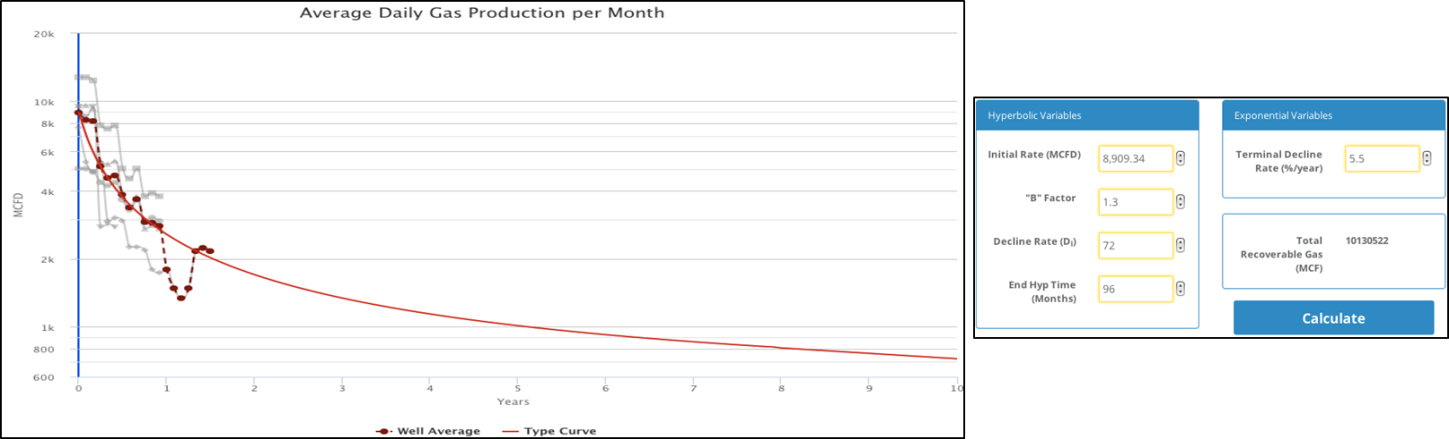
Figure 4 – Drillnomics type curve 3 for Utica shale horizontal production in Washington County.
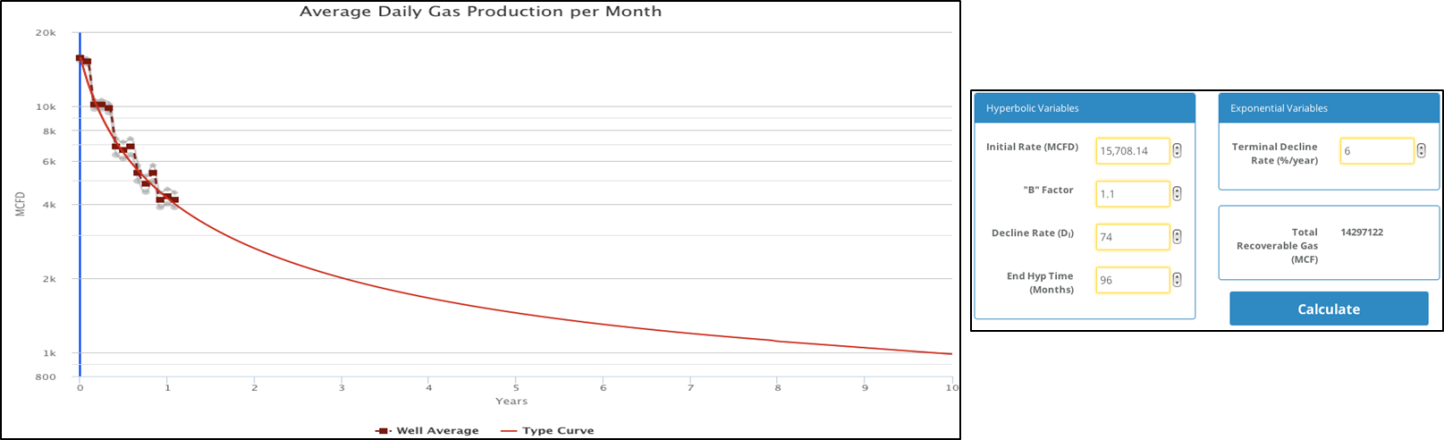
Figure 5 – Drillnomics type curve 4 for Utica shale horizontal production in Washington County.
The economic feasibility of each type curve was analyzed using economic input parameters from publically traded company investor presentations. The capital development cost is based on the average between Antero and Range Resources published cost of $1.29MM/1000’ of lateral and $1MM/1000’ of lateral. The economic sensitivity for each type curve was analyzed utilizing a range of gas prices, as shown in Figure 6.
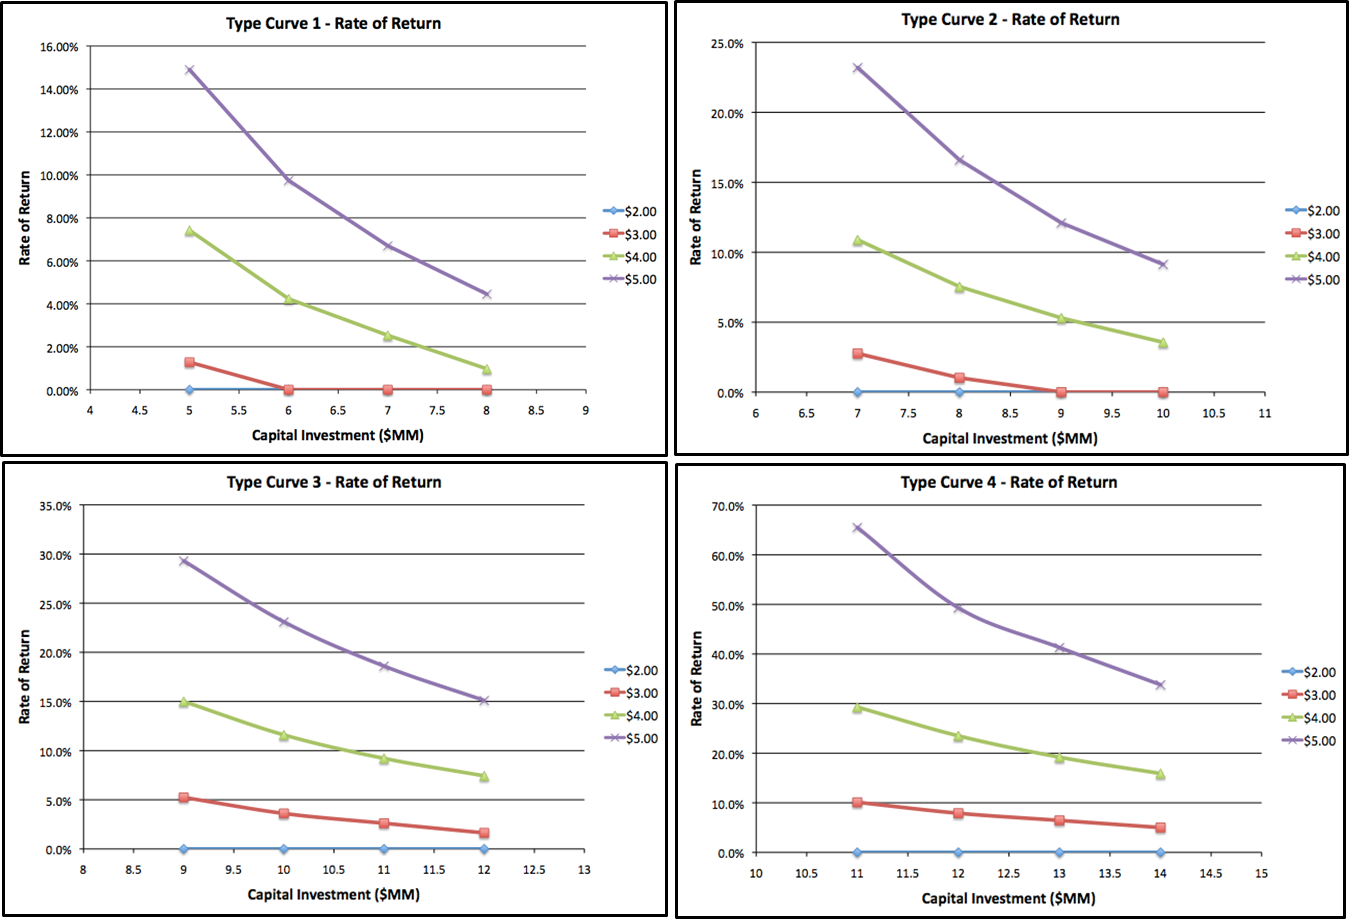
Figure 6 – Economic sensitivity for each type curve utilizing various gas prices.
There are several items that can impact the overall economic value of these projects such as realized gas prices, NGL yield, and lease operating expenses, so there is room for variance on the economic analysis. Additionally, Drillnomics notes that the EUR per lateral foot is better on the extended laterals than that on the shorter laterals, leaving room for investigation on the stimulation methods used on the wells.
Drillnomics is a web based oil and gas decline curve and economic analysis tool. The decline curves and economic evaluations were conducted by engineers from the Drillnomics team with the intention of showcasing the power of this new and revolutionary web based tool.
For more information or a free trial for Drillnomics, visit us at www.drillnomics.com and experience one of the fastest growing oil and gas tools on the market with a growth rate of over 700% in less than 1 year and a tester-to-subscriber conversion rate of nearly 80%. Follow us on Facebook and LinkedIn to continue receiving Drillnomics analysis of additional major US oil and gas plays.
This analysis is not intended for use as an investing guideline. Companies and individuals should conduct their own independent analysis before making any financial or investment decisions.
No Comments
Be the first to start a conversation