The Bakken shale within the Williston Basin has been a significant contributor to the shale revolution in the United States over the last decade. It was the first shale play to be widely developed and currently boasts the second highest production rate of the shale plays, behind the Eagle Ford. Combined, the Bakken and Eagle Ford account for approximately 60% of all shale oil production in the United States. Drillnomics has analyzed 27 horizontal Bakken wells completed on the Nesson Anticline in Mountrail county using public production data and information from publically traded companies’ investor presentations. The Nesson Anticline is considered to be one of the “sweet spots” in the Bakken and covers much of Divide, Williams, Mountrail, McKenzie, and Dunn counties. The specific focus area of this analysis is 157N 90W and 158N 90W.
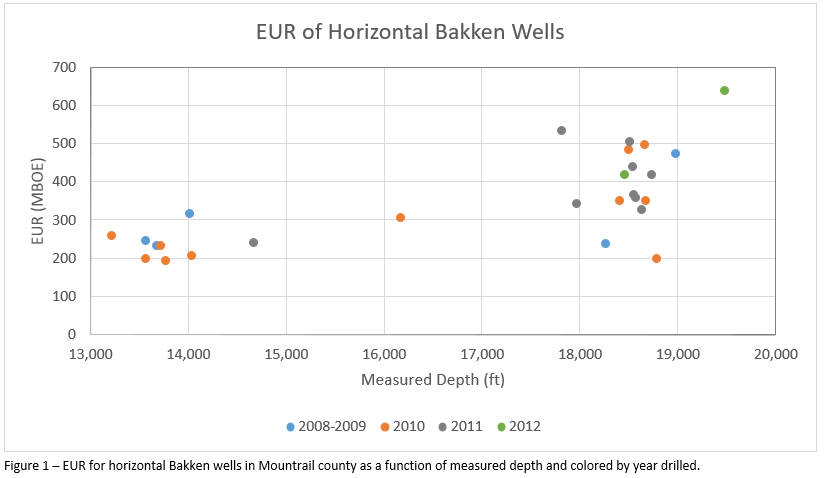
The measured depth of the 27 wells ranges from about 13,000’ to almost 19,500’. The depth of the middle member of the Bakken formation is approximately 9,000’ in this area, resulting in a range of lateral lengths from about 4,000’ to over 10,000’. Figure 1 shows the distribution of measured depth of the 27 wells compared to their EUR and the year they were drilled. The wells are clustered in two distinct groups, based on measured depth: 9 wells have a measured depth of 13,000’-15,000’ and are classified as standard lateral wells in this analysis, and 17 wells have measured depths of 17,500’-19,500’ and are classified as extended reach laterals (XRL). There is one well in the data set with a measured depth of about 16,000’, placing it in the middle of the two clusters of wells.
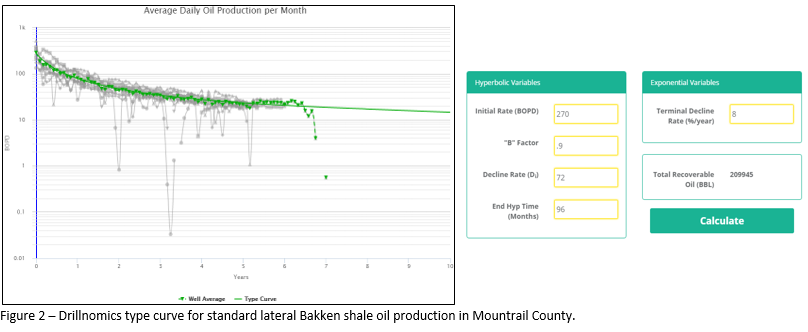
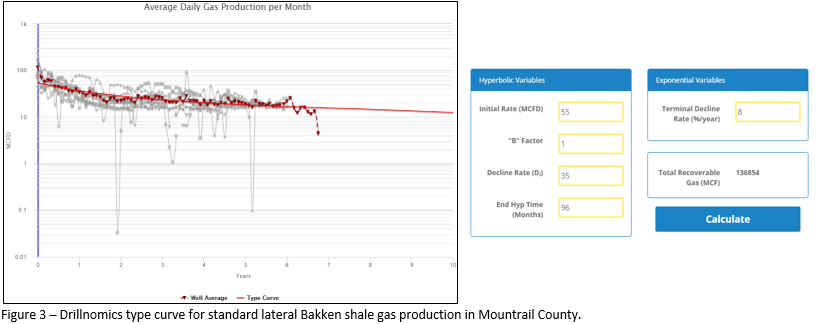
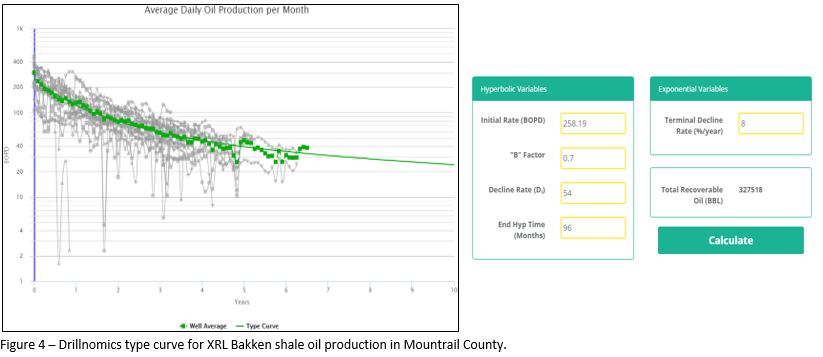
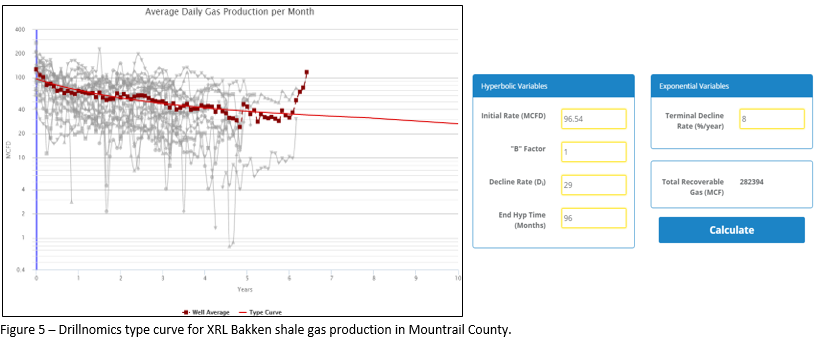
Drillnomics completed the economic analysis using two separate type curves to account for the variance in the standard and XRL laterals. Figures 2, 3, 4, and 5 show the oil and gas type curves and forecast parameters for the standard lateral wells and XRL wells, respectively.
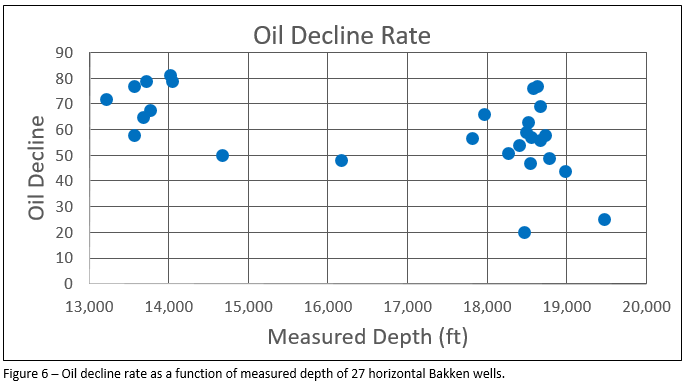
Drillnomics also analyzed the production forecast parameters for all 27 wells in the data set. As the measured depth of a well increases, the oil decline rate decreases, which contributes to the greater average EUR of the XRL wells compared to the standard lateral wells, as seen in Figure 1. Figure 6 shows this relationship. The average oil decline rate of the XRL wells is 27% lower than the standard lateral wells. The initial oil production rate of the wells is not dependent on the measured depth of the well. The average initial oil rate of the standard lateral and XRL wells is 280 BOPD and 289 BOPD, respectively.
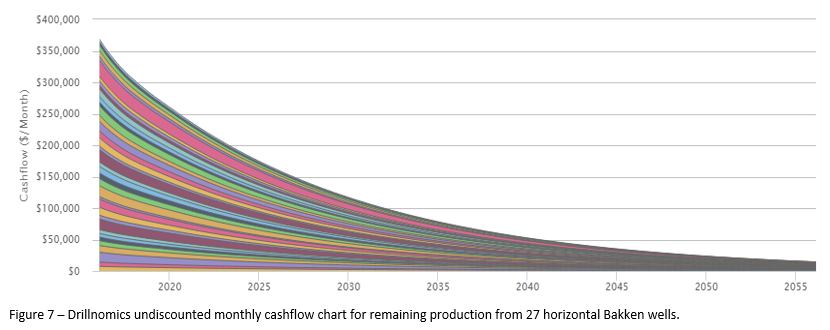
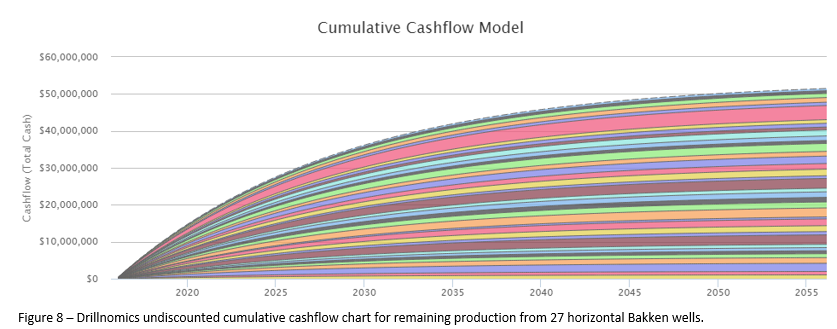
Drillnomics determined the value of the current production and remaining reserves of the wells in this analysis using economic input parameters from publically traded companies’ investor presentations. The information came from Hess Corporation and EOG, as those are the only two public operators of the wells being considered. Drillnomics calculated the remaining NPV (at 15%) of the 27 wells to be $21.1MM. Figures 7 and 8 display the projected undiscounted monthly cash flow and undiscounted cumulative cash flow, respectively, for each well. Each color in the chart represents an individual well.
Additionally, using the type curves shown in Figures 2-5 and economic input parameters from Hess Corporation and EOG, Drillnomics calculated the rate of return of a drilling a new standard lateral and XRL well in this area of the Bakken shale. At today’s commodity prices, it is not economic to drill and complete a standard lateral or XRL well. However, with improved prices (Oil: $60/bbl, Gas: $3.00/MMBTU, NGL: $20/bbl), further development based on these type curves becomes marginally economic. The rate of return of a standard lateral well and XRL well at those prices is 4% and 11.5%, respectively.
There are several items that can impact the overall value of the production and future development in this area, such as realized oil, gas, and NGL prices, NGL yield, terms of the lease, and costs (capital and LOE), so there is room for variance in the economic analysis. This article is intended to serve as a demonstration of Drillnomics’ ability to value property from the perspective of an operator or non-operating partner.
Drillnomics is a web based oil and gas decline curve and economic analysis tool. The decline curves and economic evaluations were conducted by engineers from the Drillnomics team with the intention of showcasing the power of this new and revolutionary web based tool.
For more information or a free trial for Drillnomics, visit us at www.drillnomics.com and experience one of the fastest growing oil and gas tools on the market with a growth rate of over 700% in less than 1 year and a tester-to-subscriber conversion rate of nearly 80%. Follow us on Facebook and LinkedIn to continue receiving Drillnomics analysis of additional major US oil and gas plays.
This analysis is not intended for use as an investing guideline. Companies and individuals should conduct their own independent analysis before making any financial or investment decisions.
No Comments
Be the first to start a conversation