Data Upload Options

Data can be uploaded to Drillnomics from multiple data sources:

  1. IHS – from the Output window, select the Powertools Production Export file (98p).
  2. DrillingInfo – select any of the DRI file options from the “Basic Downloads” dropdown.
  3. Excel Upload – use the following template to enter production data into an Excel spreadsheet.  The production values should be entered as total monthly oil/gas production.

New Features

Drillnomics New Features – Aug. 2016 Update

Organizational Licenses:

Drillnomics now supports organizational licensing.  Rather than purchasing and maintaining separate accounts for multiple people within a company or team, companies can purchase multiple licenses under a single organization at a discounted price.  With this organizational licensing structure, your company will receive unique log ins for up to 3 users per license purchased.  Additionally, the organization will have an assigned administrator that will be able to add and delete users from the account as needed.  This new structure improves data security and integrity and promotes collaboration between Drillnomics users.  For more information on purchasing an organizational license, please contact us!


Integrated Help Tips:

Hover over any question mark icon in the top right corner of most boxes/sections in Drillnomics to see a pop up with information about that field or section, including variable definitions, instructions and recommendations.  The pop ups contain much of the same information included in this document for quick help when creating projects.


Project Analysis Date:

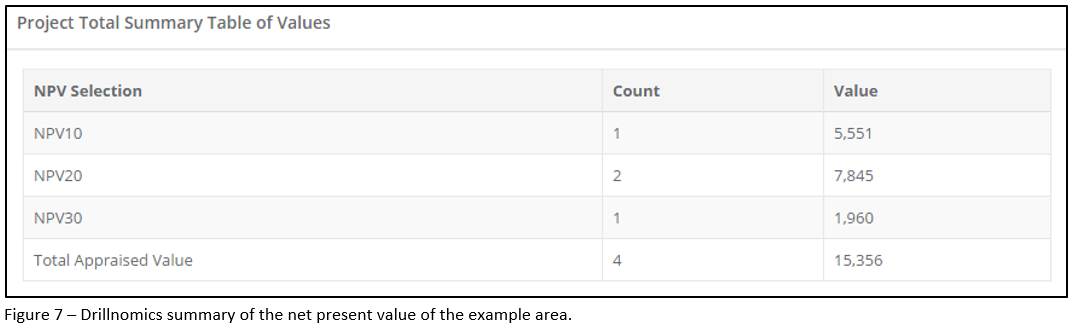
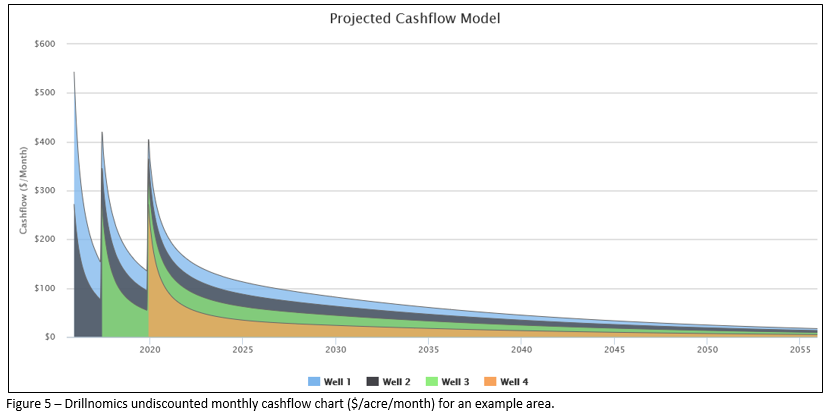
This field in the Overview tab allows for projects that are actively maintained and updated to have current economic evaluations.  Because the new version of Drillnomics enables users to update production data for wells without recreating the project, there is a need to be able to adjust the analysis date to ensure that future cashflow is being discounted to the desired date.  This field can be populated with any date.  If the Project Analysis Date is later than the Effective Revenue Start Date of a well in the project, all cashflow between the 2 dates will be undiscounted and included in the total value of the well.  Any cashflow after the Project Analysis Date will be discounted back to that date at the selected discount rate.

1


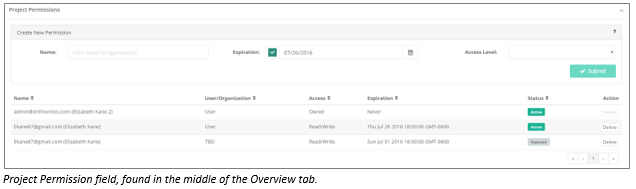
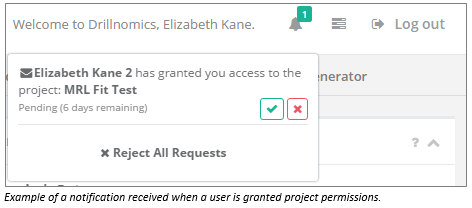
Project Permissions:

This section in the Overview tab allows users to share projects with any other Drillnomics user.  Simply type the e-mail address of the user with whom the project is being shared, select an expiration date and access level, and click submit.  The available access level options are: read only, read with copy, read/write, and owner.  The user being granted permissions will receive a notification, seen in the top right corner of any Drillnomics page (once logged on).  That user will have 3 days to accept or reject the permissions, and the permissions will automatically be revoked on the chosen expiration day.  If the owner of a shared project deletes the project, all permissions to other users will be revoked.  When a project permission is accepted by a user, the project will appear in a folder titled “Shared Projects” in the user’s project list on the left side of the screen.

2

3


Project Folders and Sorting:

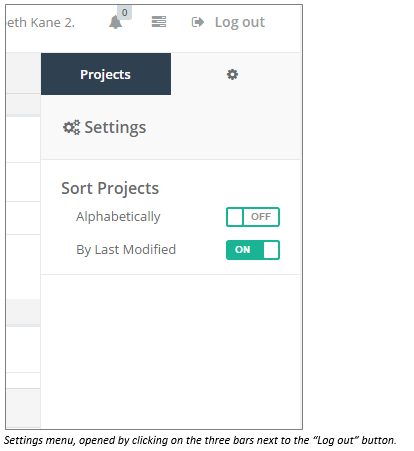
Projects can now be grouped into unique folders in the project list on the left side of the Drillnomics page.  When a new project is created, type the desired folder name in the “Folder” field underneath the “Project Name” field on the Overview tab.  Drillnomics will automatically place the project into that folder, along with any other projects having the same folder name.  Additionally, projects can now be sorted alphabetically or by last modified date (most recent at the top).  The sorting option can be changed by clicking on the settings drop down in the top right corner and toggling the desired sorting method “ON”.

4


Copying Existing Projects:

There is now a button at the bottom of the Overview tab, next to the Delete button, that allows users to create a copy of any project.  This will expedite the process of running price, cost, etc. sensitivities and will allow the user to keep a unique copy of each desired scenario.


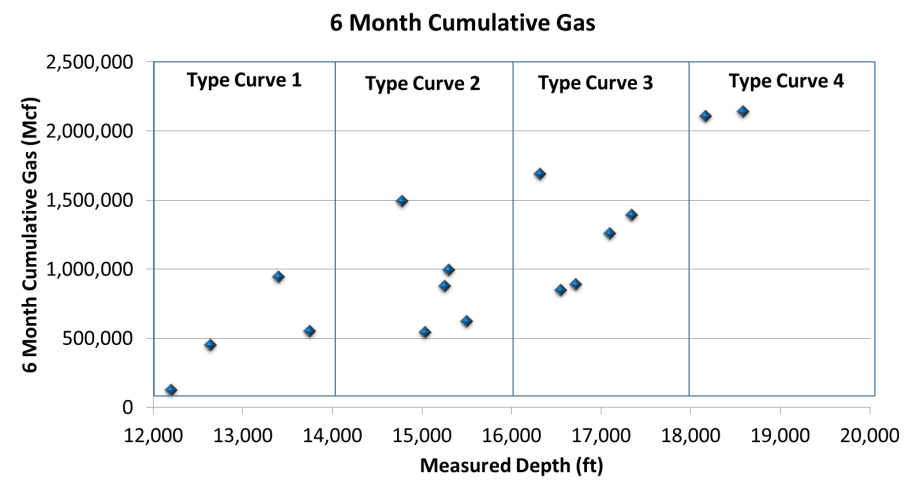
Uploading Wells to a Project:

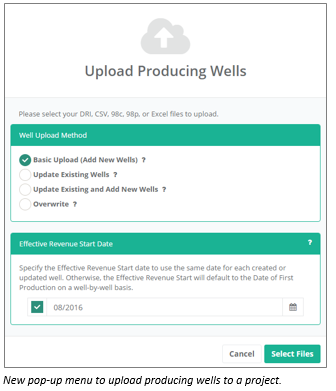
Wells are added to projects on the Production Analysis tab now (previously done on the Overview tab).  The new project structure allows users to upload as many producing and non-producing wells as needed to any project.  Previous projects were limited to one type curve per project.  There are new options available when uploaded producing data, as well.  When a user selects “Upload Producing Wells”, he will be prompted to select a well upload method.  There are four options:

  • Basic Upload (Add New Wells): A new producing well will be added for each well in the upload file, regardless of whether or not the well already exists in the project
  • Update Existing Wells: Updates data for any well in the upload file that has a matching API to a well already existing in the project. No new wells will be added to the project.  Use this option to preserve previous production forecasts but update data.
  • Update Existing and Add New Wells: Updates production data for any existing well that has a matching API to a well already existing in the project, and creates a new well for any well in the upload file that does not have a matching API in the existing project. No wells will be deleted.
  • Overwrite: Updates the project so that all wells in the project match the upload file exactly. Production forecasts for existing wells and type curve wells will be unchanged.
5


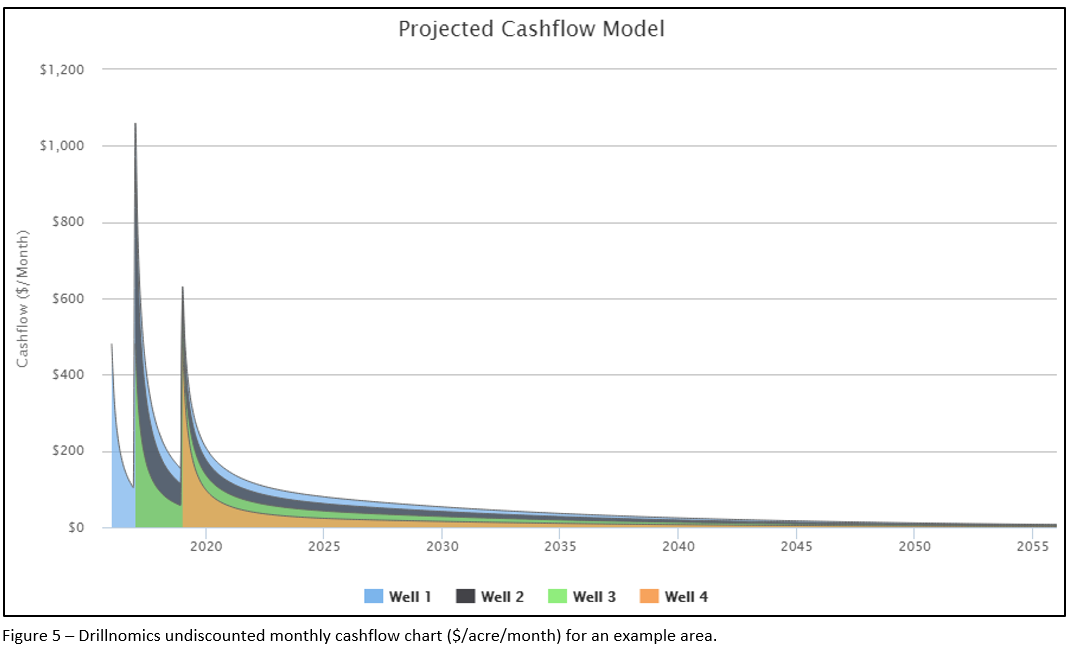
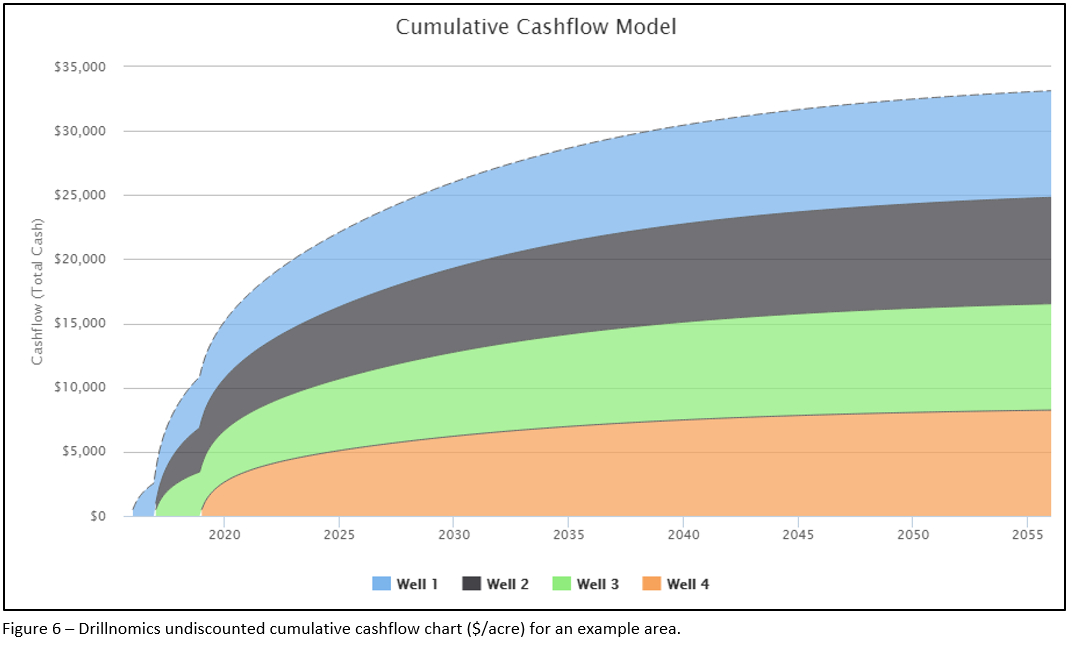
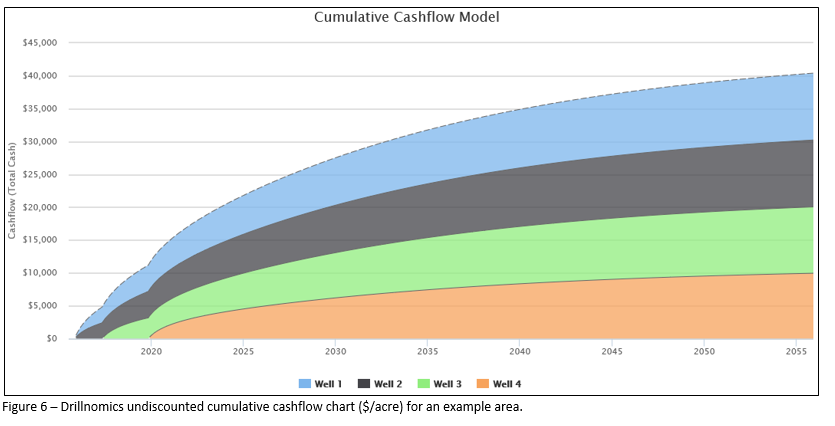
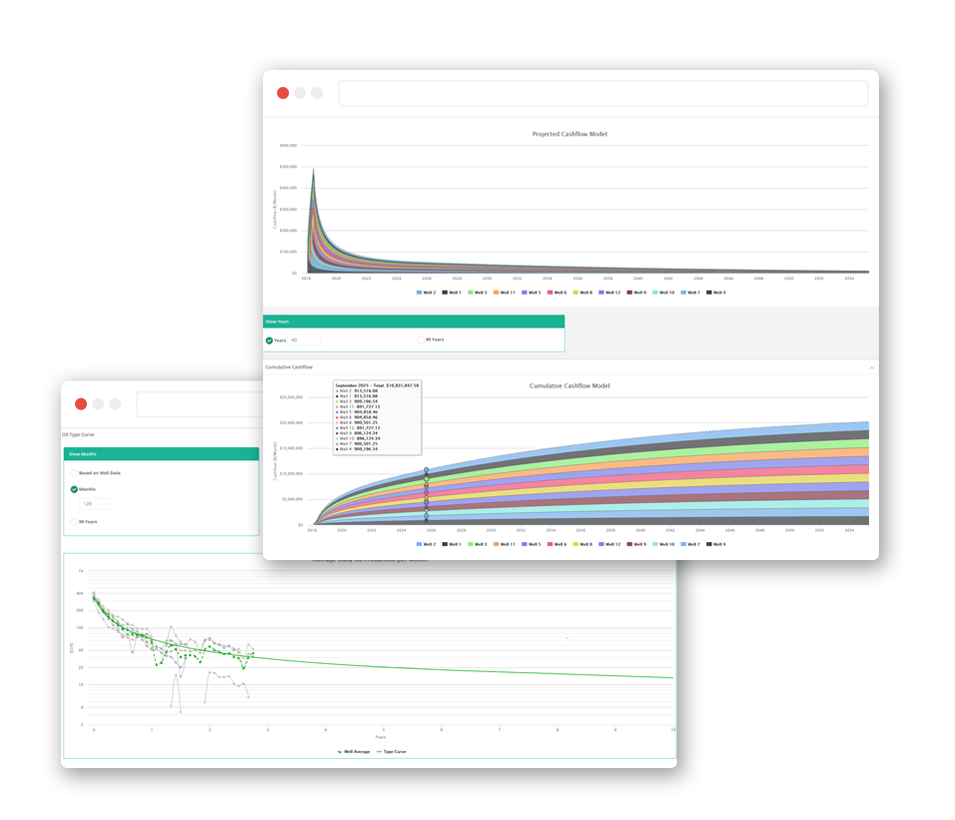
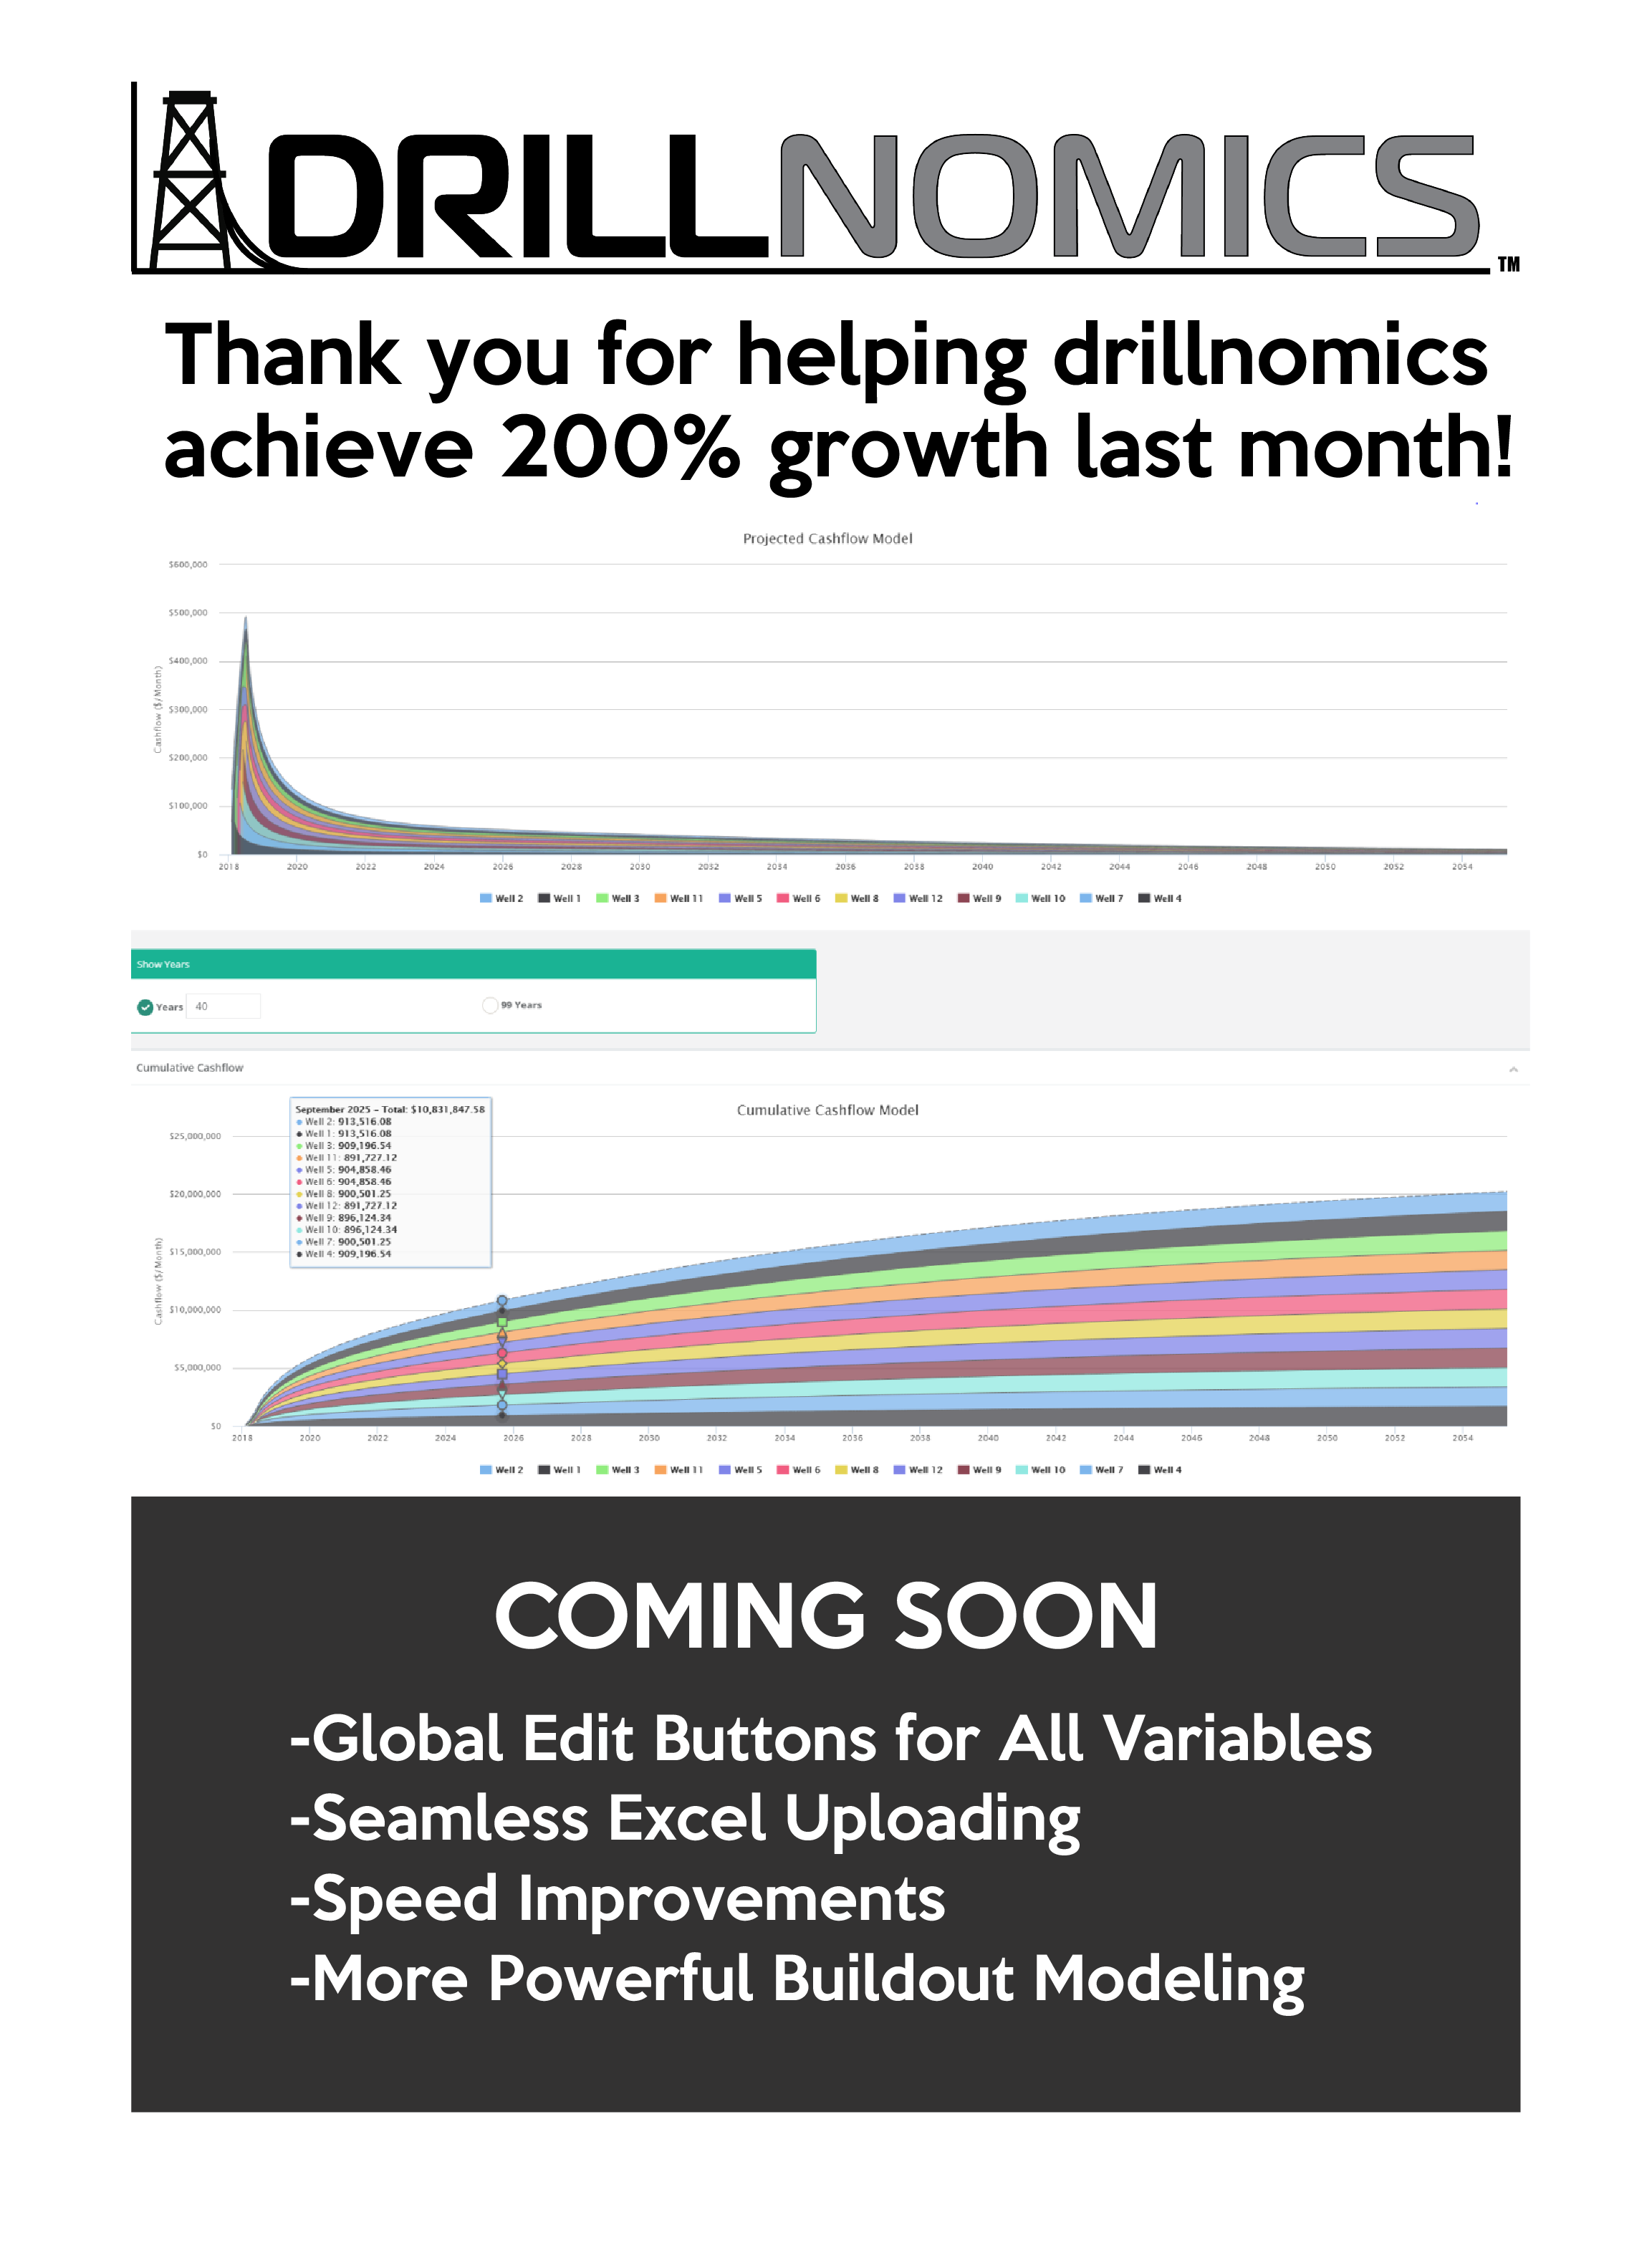
Improved Production and Cashflow Charts (Zoom and Export as an Image Features):

There is now a zoom feature available on the production and cashflow charts.  Simply click anywhere on the chart to draw a box around the desired zoom area.  The zoom feature will rescale both the x- and y-axes.  Once zoomed, a “reset zoom” button will appear in the top right corner of the chart.  Click this button to return to the original view.  The manual zoom (“Show Months” box for production charts and “Show Years” box for cashflow charts) can still be used as well.

Production and cashflow charts can be printed or exported as an image.  Click on the three horizontal lines in the top right corner of any production chart to display available options.

The box that displays when a user hovers over any point on a production or cashflow chart will now display the well name, the production/cashflow value at that point, and the actual month and year of the point.


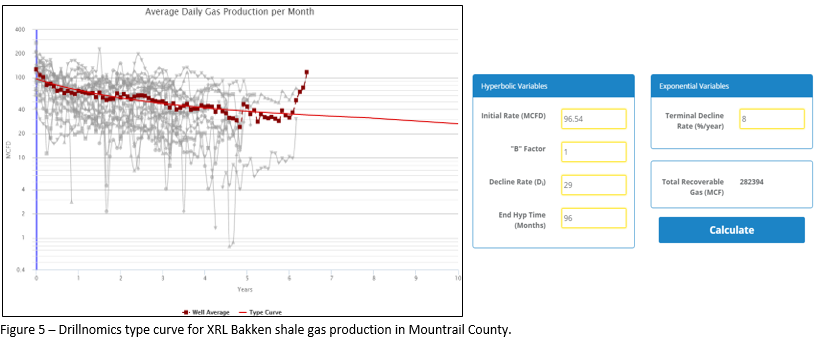
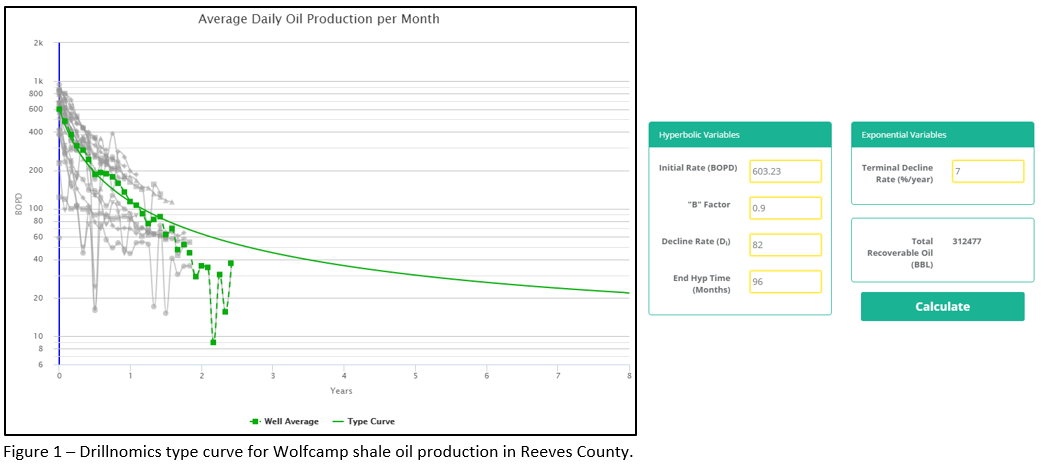
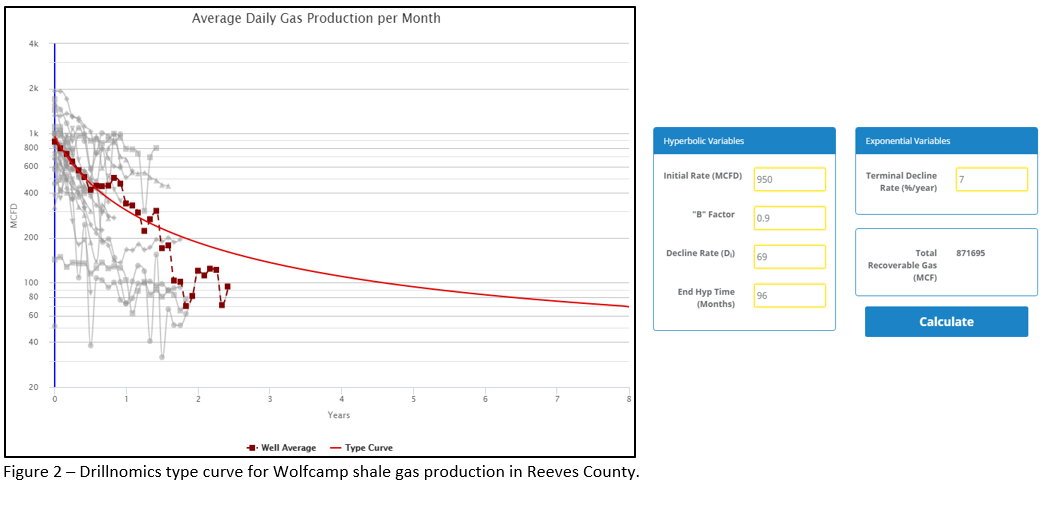
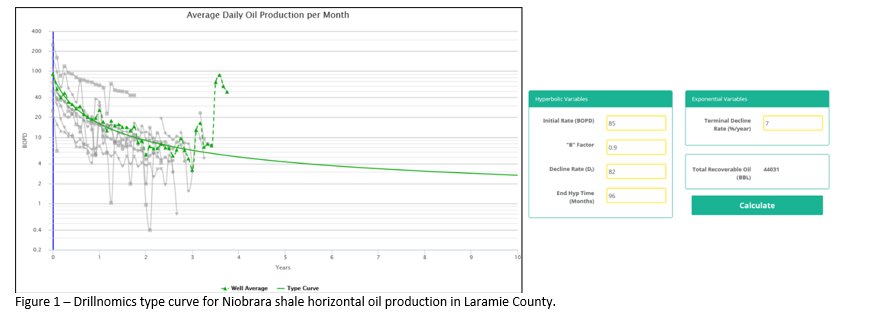
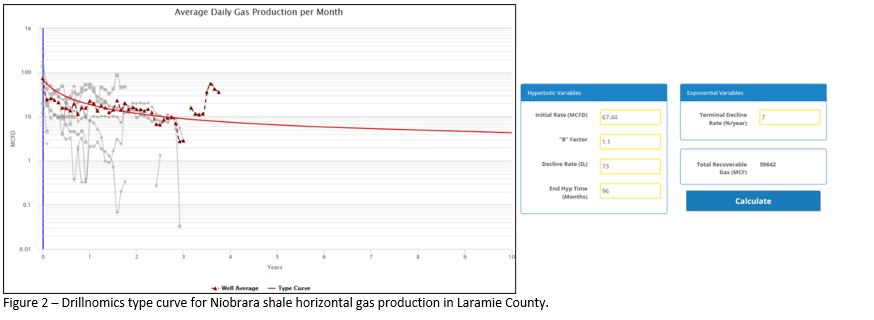
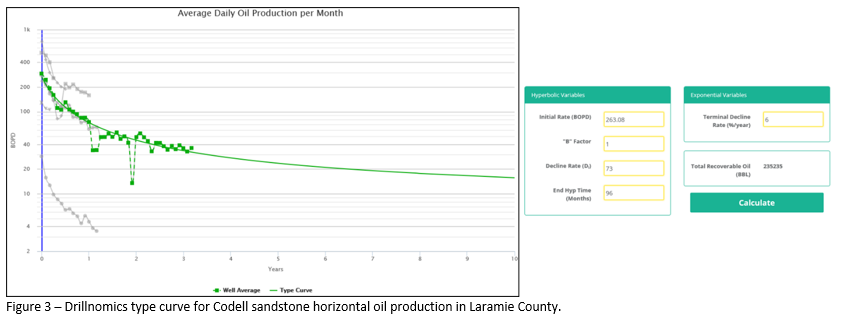
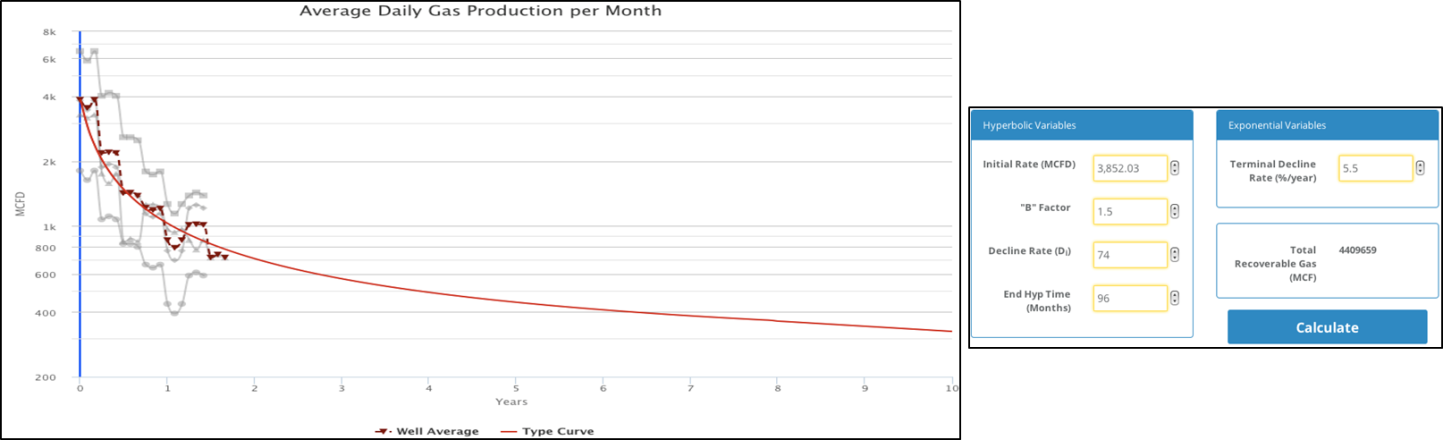
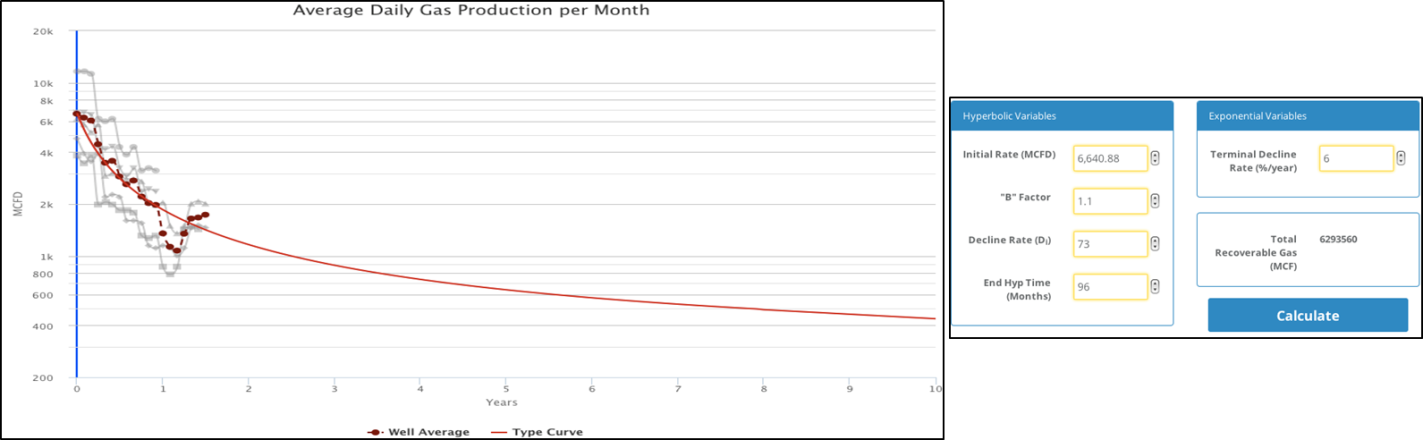
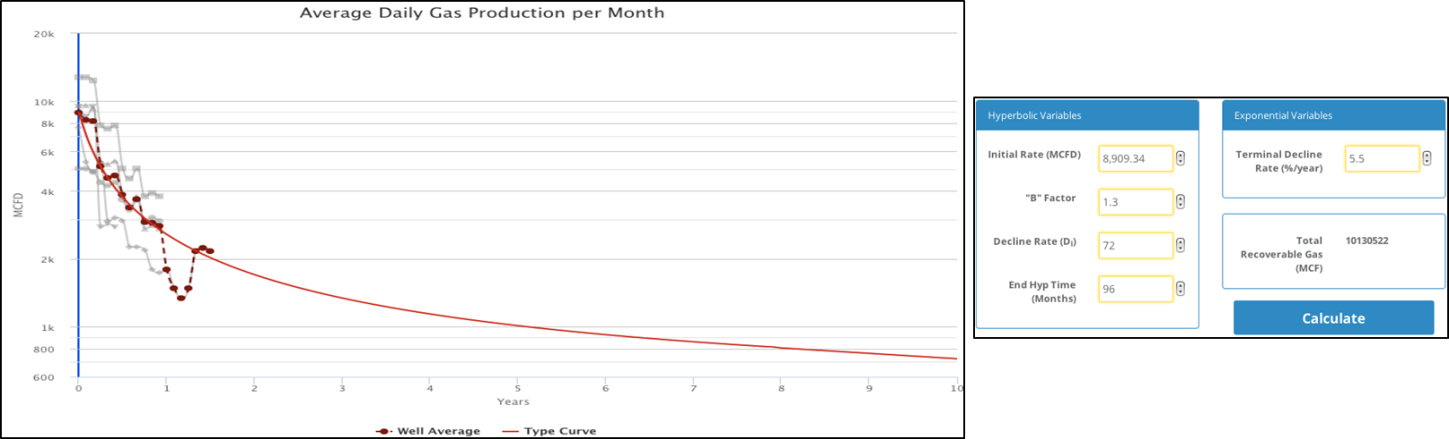
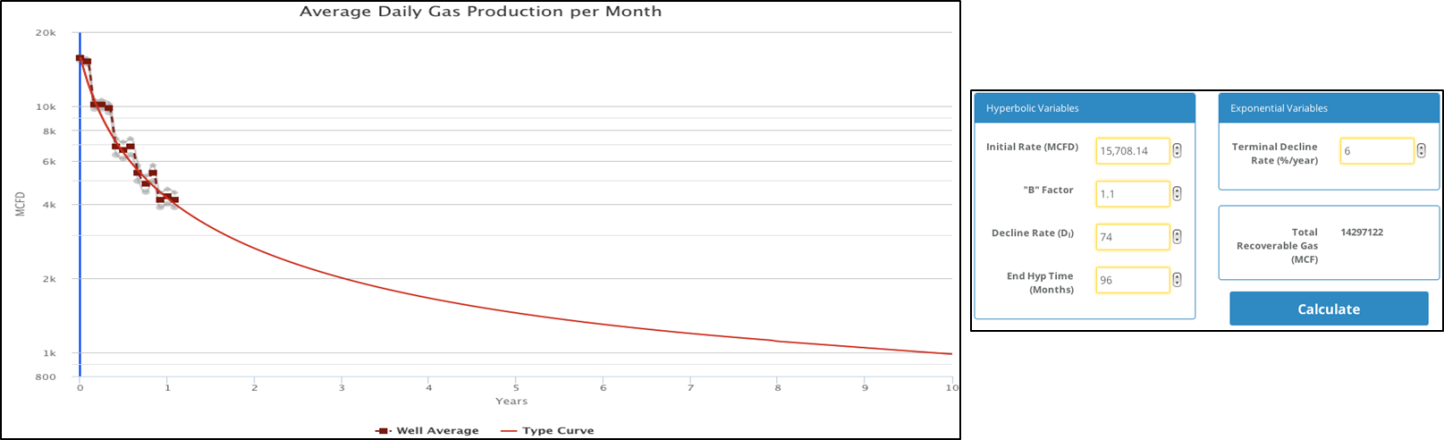
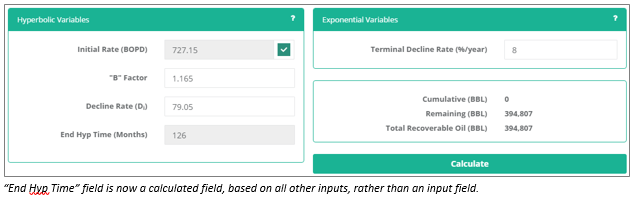
Hyperbolic to Exponential Decline Transition:

Drillnomics now calculates the date at which the transition from hyperbolic to exponential decline will occur based on the hyperbolic inputs and the terminal decline rate input by the user.  The transition will occur at the time when the hyperbolic decline rate equals the specified terminal decline rate.

6


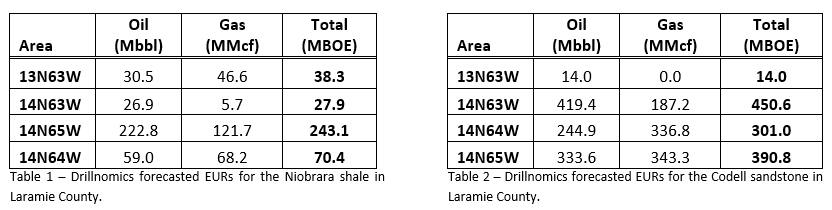
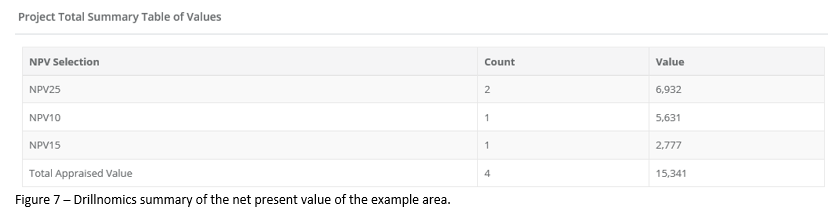
Historical Production Data and EURs:

For producing wells, Drillnomics will use the historical production data for each well when available and the user specified forecast for remainder of the well’s life to calculate cumulative production, remaining reserves, and total recoverable oil/gas (EUR).  The cumulative production is the sum of the production from the beginning of the well’s life to the Effective Revenue Start Date, remaining reserves is the sum of the forecasted production from the Effective Revenue Start Date through 99 years of production, and the EUR is the sum of the cumulative production and remaining reserves.

For non-producing (type curve) wells, the cumulative production will always be zero because type curve wells are intended to be representative well profiles used to model economics for future development of an area.  Thus, there is no historical production for a type curve and the remaining reserves and EUR will be equal.


How to Return to the Project Upgrade Wizard after Initial Log In:

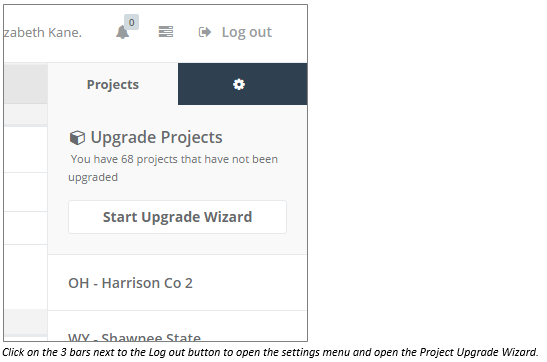
If a user chooses not to upgrade all of his projects initially, it is easy to return to the Upgrade Wizard later to upgrade any remaining projects.  There are two ways to open the wizard.

  1. Click on the Settings drop down in the top right corner of the page, then click on the projects tab. There will be a “Start Upgrade Wizard” button and a list of all projects in the account that have not been upgraded.
7
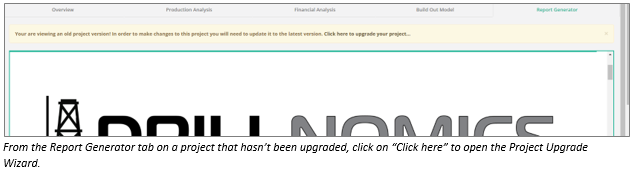
  1. When a project that has not been upgraded is opened, the Report Generator tab will open, and that will be the only tab available for that project. At the top of the report, there is a link to click to open the upgrade wizard.
8


Please contact us (720-307-0106 or admin@drillnomics.com) if you have any questions or feedback about the new features and updates.

The Bakken shale within the Williston Basin has been a significant contributor to the shale revolution in the United States over the last decade.  It was the first shale play to be widely developed and currently boasts the second highest production rate of the shale plays, behind the Eagle Ford.  Combined, the Bakken and Eagle Ford account for approximately 60% of all shale oil production in the United States.  Drillnomics has analyzed 27 horizontal Bakken wells completed on the Nesson Anticline in Mountrail county using public production data and information from publically traded companies’ investor presentations.  The Nesson Anticline is considered to be one of the “sweet spots” in the Bakken and covers much of Divide, Williams, Mountrail, McKenzie, and Dunn counties.  The specific focus area of this analysis is 157N 90W and 158N 90W.

The measured depth of the 27 wells ranges from about 13,000’ to almost 19,500’.  The depth of the middle member of the Bakken formation is approximately 9,000’ in this area, resulting in a range of lateral lengths from about 4,000’ to over 10,000’.  Figure 1 shows the distribution of measured depth of the 27 wells compared to their EUR and the year they were drilled.  The wells are clustered in two distinct groups, based on measured depth: 9 wells have a measured depth of 13,000’-15,000’ and are classified as standard lateral wells in this analysis, and 17 wells have measured depths of 17,500’-19,500’ and are classified as extended reach laterals (XRL).  There is one well in the data set with a measured depth of about 16,000’, placing it in the middle of the two clusters of wells.

ND Figure 1

Drillnomics completed the economic analysis using two separate type curves to account for the variance in the standard and XRL laterals.  Figures 2, 3, 4, and 5 show the oil and gas type curves and forecast parameters for the standard lateral wells and XRL wells, respectively.

ND figure 2 ND figure 3 ND figure 4 ND figure 5

Drillnomics also analyzed the production forecast parameters for all 27 wells in the data set.  As the measured depth of a well increases, the oil decline rate decreases, which contributes to the greater average EUR of the XRL wells compared to the standard lateral wells, as seen in Figure 1.  Figure 6 shows this relationship.  The average oil decline rate of the XRL wells is 27% lower than the standard lateral wells. The initial oil production rate of the wells is not dependent on the measured depth of the well.  The average initial oil rate of the standard lateral and XRL wells is 280 BOPD and 289 BOPD, respectively.

ND figure 6

Drillnomics determined the value of the current production and remaining reserves of the wells in this analysis using economic input parameters from publically traded companies’ investor presentations.  The information came from Hess Corporation and EOG, as those are the only two public operators of the wells being considered.  Drillnomics calculated the remaining NPV (at 15%) of the 27 wells to be $21.1MM.  Figures 7 and 8 display the projected undiscounted monthly cash flow and undiscounted cumulative cash flow, respectively, for each well.  Each color in the chart represents an individual well.

ND figure 7 ND figure 8

Additionally, using the type curves shown in Figures 2-5 and economic input parameters from Hess Corporation and EOG, Drillnomics calculated the rate of return of a drilling a new standard lateral and XRL well in this area of the Bakken shale.  At today’s commodity prices, it is not economic to drill and complete a standard lateral or XRL well.  However, with improved prices (Oil: $60/bbl, Gas: $3.00/MMBTU, NGL: $20/bbl), further development based on these type curves becomes marginally economic.  The rate of return of a standard lateral well and XRL well at those prices is 4% and 11.5%, respectively.

There are several items that can impact the overall value of the production and future development in this area, such as realized oil, gas, and NGL prices, NGL yield, terms of the lease, and costs (capital and LOE), so there is room for variance in the economic analysis.  This article is intended to serve as a demonstration of Drillnomics’ ability to value property from the perspective of an operator or non-operating partner.


Drillnomics is a web based oil and gas decline curve and economic analysis tool.  The decline curves and economic evaluations were conducted by engineers from the Drillnomics team with the intention of showcasing the power of this new and revolutionary web based tool. 

For more information or a free trial for Drillnomics, visit us at www.drillnomics.com and experience one of the fastest growing oil and gas tools on the market with a growth rate of over 700% in less than 1 year and a tester-to-subscriber conversion rate of nearly 80%.  Follow us on Facebook and LinkedIn to continue receiving Drillnomics analysis of additional major US oil and gas plays.

This analysis is not intended for use as an investing guideline.  Companies and individuals should conduct their own independent analysis before making any financial or investment decisions. 


In the last 5 years, the mature Permian Basin has been brought back into the oil and gas spotlight as one of the most prolific unconventional resource plays in the United States with the discovery and development of shale formations.  Development in the Permian Basin, and specifically the Delaware Basin, which is located on the western side of the greater Permian Basin, has historically been achieved through vertical drilling and production.  In the last 5 years, much of the development has shifted to horizontal completions in the shale zones.  The two main shale formations in the Delaware Basin are the Wolfcamp and the Bone Spring.  Drillnomics has analyzed 27 producing horizontal wells in the Wolfcamp formation using public production data and information from publically traded companies’ investor presentations.  While the Delaware Basin covers much of Eddy and Lea counties in New Mexico and the west Texas counties of Culberson, Loving, Reeves and Ward, this analysis focus on horizontal Wolfcamp wells in block 50 T8S and block 51 T8S, which are in the south east portion of Reeves county, Texas.  Figures 1 and 2 show the oil and gas type curves developed for the Wolfcamp formation in this area.

TX figure 1 TX figure 2

Drillnomics compared the average peak 30-day rates (Boe/d) of the 27 type curve wells to the peak 30-day rates reported by operators.  Figure 3 shows this comparison.  It should be noted that the focus area of this analysis is on the south end of the Wolfcamp play and results reported by operators are derived from wells across the entire Wolfcamp play in the Delaware Basin.

TX figure 3

The economic feasibility of the Drillnomics type curve was analyzed using economic input parameters from publically traded companies’ investor presentations.  The capital development cost is based on data from Occidental Petroleum Corporation, Apache Corporation, and Energen.  The lease operating expense is based on data from Rosetta Resources, Concho Resources, and Energen.  The economic sensitivity for each type curve was analyzed utilizing a range of oil, gas and NGL prices, as shown in Figure 4.

TX figure 4

Drillnomics also calculated a hypothetical cashflow model per acre of the acreage in the southern portion of the Wolfcamp play using the type curve for the region.  The economic input parameters are based on public data from Apache Corporation, Occidental Petroleum Corporation, Rosetta Resources, Concho Resources and Energen investor presentations. An example of the undiscounted cashflow and cumulative cashflow charts generated by Drillnomics are shown in Figures 5 and 6.  In this example, it is assumed that this particular area will have 1 well producing at the starting date of the analysis, an additional 2 wells brought on at the beginning of year 2 of the analysis, and the final well brought on 4 years into the analysis.  The cashflow base assumptions assume a 15% royalty and 1 net mineral acre on a 160 acre spacing unit so that the mineral value can be reported on a dollar per acre metric.  Figure 7 shows the Drillnomics value summary for this example, using the type curves and future development assumptions discussed above.

TX figure 5 TX figure 6 TX figure 7

There are several items that can impact the overall value of the minerals in these areas, such as realized gas prices, NGL yield, and terms of the lease, so there is room for variance on the economic analysis.  This article is intended to serve as a demonstration of Drillnomics’ ability to value property from the perspective of an operator, non-operating partner, or mineral owner.


Drillnomics is a web based oil and gas decline curve and economic analysis tool.  The decline curves and economic evaluations were conducted by engineers from the Drillnomics team with the intention of showcasing the power of this new and revolutionary web based tool.

For more information or a free trial for Drillnomics, visit us at www.drillnomics.com and experience one of the fastest growing oil and gas tools on the market with a growth rate of over 700% in less than 1 year and a tester-to-subscriber conversion rate of nearly 80%.  Follow us on Facebook and LinkedIn to continue receiving Drillnomics analysis of additional major US oil and gas plays.

This analysis is not intended for use as an investing guideline.  Companies and individuals should conduct their own independent analysis before making any financial or investment decisions.

Oil and gas production in Laramie County, Wyoming has increased over the last 10 years with the increased development in the Niobrara shale formation and then again, more recently, with the discovery and development of the Codell sandstone formation. Drillnomics has analyzed 15 horizontal producing wells in the southeast portion of Laramie County using public production data and information from publically traded companies’ investor presentations. The evaluation and analysis includes 8 horizontal Niobrara shale wells and 7 horizontal Codell sandstone wells. The analysis focus area is 13N63W, 14N63W, 14N64W, and 14N65W. Figures 1-4 show the oil and gas type curves developed for the Niobrara shale and Codell sandstone formations for these areas.
WY figure 1
WY figure 2
WY figure 3WY figure 4
Drillnomics also analyzed this same group of wells on a township/range level. Tables 1 and 2 show the EUR of the type curves for the Niobrara and Codell in each township/range.WY Figure 8

Drillnomics calculated a cashflow model per acre for the Niobrara/Codell type curve in the region. The economic input parameters are based on public data from EOG Resources, Bill Barrett Corporation, and Sundance Energy investor presentations. An example of the undiscounted cashflow and cumulative cashflow charts generated by Drillnomics are shown in Figures 5 and 6. In this example, it is assumed that this particular area will have 2 wells producing at the starting date of the analysis, an additional well brought on 1.5 years into the analysis, and the final well brought on 4 years into the analysis. The cashflow base assumptions assume an 18.75% royalty and 1 net mineral acre on a 160 acre spacing unit so that the mineral value can be reported on a dollar per acre metric. Figure 7 shows the Drillnomics value summary for this example, using the type curves and future development assumptions discussed above.

WY figure 5                                                                                                                                WY figure 6
WY figure 7
There are several items that can impact the overall value of the minerals in these areas, such as realized gas prices, NGL yield, and terms of the lease, so there is room for variance on the economic analysis. In this example, Drillnomics calculated the value of the minerals to the owner, assuming a 0% working interest and a royalty set by the terms of the lease. Drillnomics is also capable of using the same type curves with different economic inputs to determine the economic value of existing wells and future development projects to an operator or other entity with a working interest in the area.
________________________________________
Drillnomics is a web based oil and gas decline curve and economic analysis tool. The decline curves and economic evaluations were conducted by engineers from the Drillnomics team with the intention of showcasing the power of this new and revolutionary web based tool.
For more information or a free trial for Drillnomics, visit us at www.drillnomics.com and experience one of the fastest growing oil and gas tools on the market with a growth rate of over 700% in less than 1 year and a tester-to-subscriber conversion rate of nearly 80%. Follow us on Facebook and LinkedIn to continue receiving Drillnomics analysis of additional major US oil and gas plays.
This analysis is not intended for use as an investing guideline. Companies and individuals should conduct their own independent analysis before making any financial or investment decisions.

Drillnomics is changing the way the oil and gas industry runs economic evaluations! Check out the Drillnomics Shale Plays Bakken article published on Shale Plays Media about how Drillnomics can help large and small oil companies and investment firms take advantage of the current buyer’s market.


Easy to use well economics software provides relevant data in minutes days

By Heather Zinger

In a cyclical industry like oil and gas, people generally expect dramatic market fluctuations; however, when the price of oil drops by 50% like it did last year and remains low, companies inevitably struggle. Modified drilling plans, lower rig counts, layoffs and focus on existing production are some of this year’s themes, and it is the rare oil company that can sustain a positive cash flow.

But as any good economist knows, turbulent market conditions can mean great deals for savvy companies and investors; especially if they can evaluate potential deals quickly and accurately with a powerful economic evaluation tool like Drillnomics.

As many E&P companies struggle to survive the market lull, they’re also ironically surrounded by some of the best opportunities at expanding their businesses. If they can afford to, now is the time to acquire new assets. According to Austin Akers from Drillnomics, “In light of current market conditions, many companies are cutting their operating budgets and are looking to sell great assets at a discount in order to stay afloat. Because the price of oil is so low, many sellers are desperate to generate cash, making it a buyer’s market.”

The problem is, though, for those operating within small margins, one bad decision could spell the beginning of the end.

This is where Drillnomics can help, allowing users to run well economics in mere minutes instead of hours. Akers says, “Both large and small oil companies and investment firms can harness Drillnomics to accurately evaluate and screen a large number of deals, allowing them to identify those that offer the best return on investment.”

A recently released software product, Drillnomics is a web-based oil and gas decline curve/economic evaluation tool. Using this tool, users can evaluate producing (PDP) and non-producing (PUD) oil and gas interests.

pic dn article2 (00000002Drillnomics)

Drillnomics is a robust tool with multiple capabilities ranging from analyzing the economic value of capital projects to appraising leasehold, mineral, royalty and other interests. Users can create drilling program build-out models with multiple wells over a custom timeline to forecast future production and determine the present value of cash flows. It also can provide compelling insight into potential revenue, pricing and capital assumptions.

Users can import well data directly from databases they subscribe to, such as IHS and DrillingInfo, or can upload their own data via Excel spreadsheets. By benchmarking against comparable wells, users can easily manipulate type curves to build accurate production/cash flow models. After plotting data and entering a few key variables, Drillnomics generates sleek, intuitive graphs and tables that show Average Daily Oil Production, Net Monthly Cashflow, a Present Worth Profile, Total Recommended Purchase Value and Cumulative Cashflow. The results are visualized in data sets that clearly show a well’s future production and revenue.


What specifically sets Drillnomics apart from comparable programs is its ease of use. It’s not necessary to have a background in engineering to input data and create meaningful reports. With its global edit capabilities, users can change variables with the click of a button to see evaluations based on a new data set. For example, if the price of oil or anticipated lease operating expenses change, users can modify their calculations with a few clicks, making it easy to run economics under different scenarios. From there, users can generate and print PDF reports to show to managers and other stakeholders.

Paramount to most companies these days, Drillnomics is also affordable. Because Drillnomics is targeting a larger segment of the market and is web-based, the yearly cost is not $25,000. It’s not $40,000. It’s more inexpensive than the competition, maxing out at $1500 a year. With the help of Drillnomics, smart companies can weather through, and even capitalize on, the current market lull.

Interested in trying Drillnomics yourself? Click here for your FREE 7 day trial.

The Utica/Point Pleasant shale play has triggered a large stir in the oil and gas world.  The shale play that initially kicked off with the Chesapeake Energy hype in Carrol and Jefferson Counties has now expanded south into new areas such as Washington, Noble, and Monroe Counties.  The Utica expansion into these areas has been analyzed by Drillnomics using public production data and information from publically traded investor presentations.

The Utica shale play in northern Washington county and southern Noble and Monroe Counties is early in development which leaves a lot of room for opportunity.  Drillnomics evaluated 16 horizontal Utica shale wells that had greater than 6 months of production history.  The analysis focus area is Graysville Township in Washington County and the surrounding townships.  Figure 1 shows the 6 month cumulative gas production as it relates to the measured depth of the well.  The depth of the Utica is reasonably consistent in the area; therefore, the measured depth is a reasonable indicator of the lateral lengths for each well.

6 month cum gas

Figure 1 – Six month cumulative gas production from horizontal Utica wells in Washington County area as a function of total measured depth.

Based on the measured depth variance, Drilllnomics separated the wells into four different type curves to analyze the EUR and estimated economic viability of the wells, as shown in Figure 1.  The type curves of each measured depth grouping are listed below in Figures 2, 3, 4, and 5 with the forecast parameters listed next to each graph.

figure 2 Figure 2 – Drillnomics type curve 1 for Utica shale horizontal production in Washington County.

figure 3

Figure 3 – Drillnomics type curve 2 for Utica shale horizontal production in Washington County.

figure 4

Figure 4 – Drillnomics type curve 3 for Utica shale horizontal production in Washington County.

figure 5

Figure 5 – Drillnomics type curve 4 for Utica shale horizontal production in Washington County.

The economic feasibility of each type curve was analyzed using economic input parameters from publically traded company investor presentations.  The capital development cost is based on the average between Antero and Range Resources published cost of $1.29MM/1000’ of lateral and $1MM/1000’ of lateral.  The economic sensitivity for each type curve was analyzed utilizing a range of gas prices, as shown in Figure 6.

figure 6

Figure 6 – Economic sensitivity for each type curve utilizing various gas prices.

There are several items that can impact the overall economic value of these projects such as realized gas prices, NGL yield, and lease operating expenses, so there is room for variance on the economic analysis.  Additionally, Drillnomics notes that the EUR per lateral foot is better on the extended laterals than that on the shorter laterals, leaving room for investigation on the stimulation methods used on the wells.

Drillnomics is a web based oil and gas decline curve and economic analysis tool.  The decline curves and economic evaluations were conducted by engineers from the Drillnomics team with the intention of showcasing the power of this new and revolutionary web based tool.

For more information or a free trial for Drillnomics, visit us at www.drillnomics.com and experience one of the fastest growing oil and gas tools on the market with a growth rate of over 700% in less than 1 year and a tester-to-subscriber conversion rate of nearly 80%.  Follow us on Facebook and LinkedIn to continue receiving Drillnomics analysis of additional major US oil and gas plays.

This analysis is not intended for use as an investing guideline.  Companies and individuals should conduct their own independent analysis before making any financial or investment decisions. 

Drillnomics released its oil and gas economic evaluation and decline curve software to the public this quarter, and industry response has been overwhelmingly positive. With the company growing at a rate of over 50% per month and a free trial to subscriber conversion rate of over 60%, the product is quickly capturing market share.  In light of recent success and to help customers manage their budgets during tough market conditions, the company is extending its promotional pricing campaign through the end of the year.

Developed for engineers, investors, landmen and geologists as a powerful but more affordable alternative to Aries, PHDWin and PowerTools, Drillnomics gives users the ability to quickly and easily evaluate oil and gas opportunities.

With the ability to create detailed build-out models to determine the net present value of cash flows for both producing and non-producing oil and gas interests, Drillnomics enables users to screen acquisitions and divestitures quickly; analyze the economic value of workovers or capital projects; gain insight into potential production, revenue, pricing and capital assumptions; and appraise leasehold, working, mineral or overriding royalty interests.

Designed to be powerful but incredibly easy to use, users can upload well production data directly from DrillingInfo and IHS, or can use Excel to build their own custom data files. With its modern and intuitive interface, Drillnomics gives users the power to build type curves and run accurate economic models in minutes.

In addition to being functionally sleek, the output reporting features in Drillnomics provide easy to follow charts and expandable tables so that users can easily digest data and view monthly detail as necessary.  The software also has a report generator feature that summarizes the input data and economic results into a printable format that can easily be presented to management and other stakeholders. Depending on the situation, users can harness Drillnomics to perform high-level technical analysis, or as a preliminary tool to quickly screen the economic feasibility of opportunities.

Drillnomics separates itself functionally form competitors through its ease of use.  By stripping away redundant functions and emphasizing simplicity, individuals with minimal experience running technical evaluations can learn how to effectively use the software. Yet even with an emphasis on efficiency, Drillnomics is robust enough to satisfy the requirements of engineers running detailed technical evaluations.

drillnomics type curve and charts

Unlike competitors’ products, Drillnomics is web-based.  This means that a license is not attached to a single computer or network.  Users can log into their accounts and access their projects on any smart phone, tablet or computer with an internet connection, which can be essential for those who travel, work in different locations, or wish to show their evaluations to stakeholders outside of their company’s network.

By targeting a wide spectrum of the industry, Drillnomics is able to offer the software to subscribers at a fraction of the cost of other evaluation tools.  Priced so that large and small companies and independent contractors alike can afford it during the current lull in commodity pricing, Drillnomics has chosen to extend its discounted pricing model through the end of the year.  New subscribers can lock in a monthly rate of $75 per month for three months, or $1,000 for an annual subscription. In Q1 2016, introductory prices are set to increase to the normal rate of $150 per month or $1,500 per year.

Drillnomics is currently offering 7-day free trials for anyone interested in trying out the software.  Navigate to www.drillnomics.com  and sign up, or call 615-933-0822 to receive login credentials and/or to receive more information about the software.

As oil prices continue to linger in the $50 per barrel range, everyone in the industry is looking to cut expenses. Whether you’re a big-time operator or independent landman, chances are you’ve slashed your budget and have been looking at ways to become more efficient.  Even with these difficulties, those who intelligently respond to the current economic climate stand to be successful, and the ability to quickly and easily evaluate deals and run well economics are among the most important variables essential to that success.

Up until now, the selection of oil and gas economic software programs has been tiny.  With the main players being PHDWin, Aries and Power Tools, smaller operators and independent contractors have been priced out, and larger entities have been stuck paying over $20,000 for cumbersome tools.  Fortunately, Drillnomics is taking the industry by storm, disrupting the market and giving small and large companies alike the power to screen deals and build economic models quicker and more effectively than ever before.

Price:

Drillnomics is priced so that every company in the oil and gas industry can afford it. With annual subscriptions of $1,500 and monthly plans available at $150/month, Drillnomics costs a fraction of the $6,000-$25,000 that other companies charge.

Convenience:

Unlike competitors’ products, Drillnomics is web-based.  This means that a license is not attached to a single computer or network.  You can log into your account and access your projects on any smart phone, tablet or computer with an internet connection.

Support:

Drillnomics offers ongoing support, free tutorials and online webinars  to all subscribers.

Simplicity/Time Saving:

One of the biggest reasons subscribers switch to Drillnomics is because it saves time.  Unlike cumbersome programs, which often take hours or days to run an evaluation, Drillnomics users can evaluate complex producing (PDP) and non-producing (PUD) oil and gas interests in minutes.  Even massive E&P companies are using Drillnomics to screen large deals and gain powerful insight into the economic value of various drilling opportunities.

Power:

Although intuitive, Drillnomics offers cutting edge analytical capabilities.  Whether you’re looking to appraise the value of mineral rights and royalties, or evaluate the feasibility of an entire drilling program, Drillnomics gives you the power to create detailed build-out models to determine the PV values of cash flows for  both producing and non-producing interests.

If you are interested in trying Drillnomics, you can get a free seven-day trial by submitting a contact form at www.drillnomics.com , emailing info@drillnomics.com, or calling 615-523-2663.  Free weekly demos and Q&As are also offered online and in-person at select cities across the USA.  Please visit our website for instructional videos.